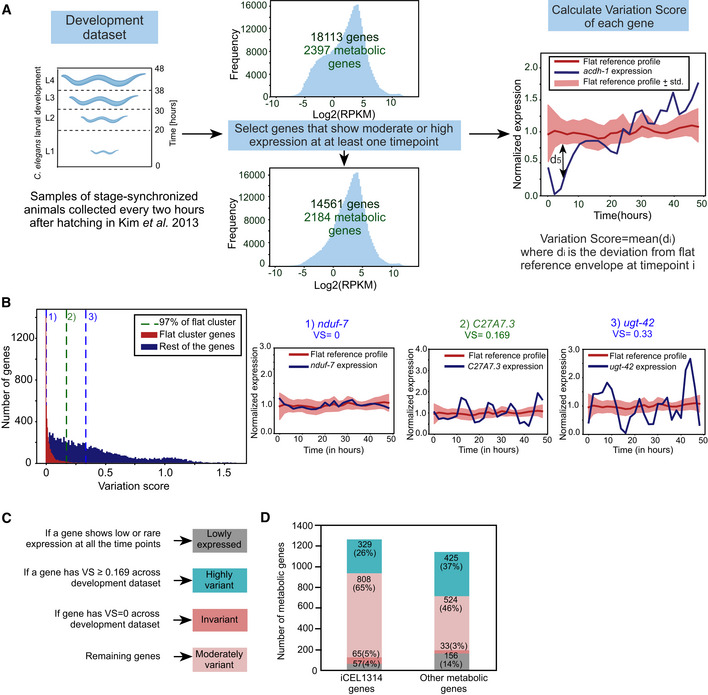
Figure EV1. Transcriptional regulation of metabolism during development.

- Computational pipeline to identify highly variant metabolic genes during development. Genes that showed either moderate or high expression in at least one time point were selected, reducing the number of genes from 18,113 (2,397 metabolic) to 14,561 (2,184 metabolic). For each gene, VS was calculated using the deviation from a flat reference profile at each time point (see Materials and Methods). The red line indicates the mean value and light red shaded area the standard deviation of the flat reference profile. The profile of acdh‐1 is plotted in blue as an example of a developmentally regulated gene. d5 denotes the deviation of acdh‐1 expression from the flat reference profile at the 5th data point.
- Distribution of VS of genes belonging to the flat cluster versus those belonging to other clusters. The vertical lines at 1 and 3 represent the iCEL1314 genes nduf‐7 and ugt‐42, which have the lowest and highest VS of the flat set, respectively. The vertical line at 2 indicates the gene C27A7.3 with selected threshold of VS at the 97% quantile of the flat cluster (VS = 0.169).
- Diagram showing criterion of categorizing metabolic and nonmetabolic genes into four categories across development: lowly expressed, invariant, moderately variant and highly variant.
- Bar graph shows the distinction of low expressed, invariant, moderately variant and highly variant genes during development in iCEL1314 and other metabolic genes. Color legend as indicated in (C).
