-
A
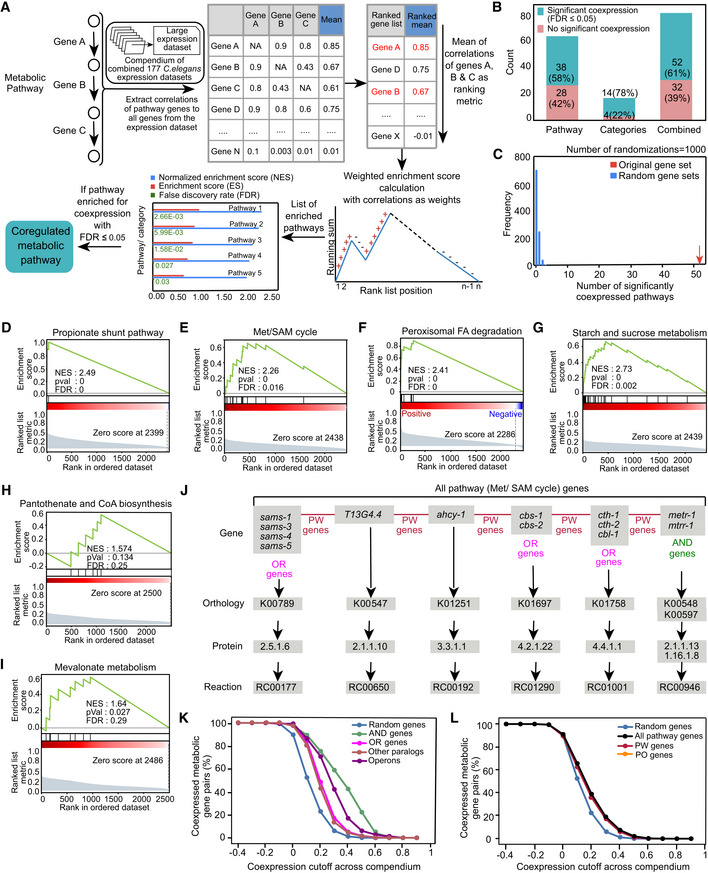
Custom computational pathway enrichment analysis pipeline that determines coexpressed genes functioning in the same metabolic pathway. Pairwise coexpression was based on the gene expression compendium. For every annotated metabolic pathway, the coexpression of pathway genes (columns) to all metabolic genes (rows) was extracted. A ranked list of genes was obtained for each pathway by taking the mean of coexpression values in rows while ignoring self‐correlations. Weighted gene set enrichment analysis was then performed to find significantly enriched pathways. If a pathway is self‐enriched with FDR ≤ 0.05, it is annotated as coexpressed.
-
B
Bar graph indicating the percentage of metabolic pathways and categories that show significant coexpression compared with ones that are not self‐enriched for coexpression.
-
C
Histogram denoting the number of significantly coexpressed metabolic pathways obtained by 1,000 randomizations while maintaining the structure of the data.
-
D–I
Mountain plots showing self‐enrichment of (D) propionate shunt pathway, (E) Met/SAM cycle, (F) peroxisomal fatty acid degradation pathway, (G) starch and sucrose metabolism, (H) pantothenate and CoA biosynthesis, and (I) mevalonate metabolism.
-
J
Metabolic pathways often consist of reactions catalyzed by single genes, OR genes and AND genes. All genes involved in the same pathway are collectively annotated as all pathway genes. Genes that are associated with distinct reactions are annotated as PW genes. PW gene pairs exclude AND and OR gene pairs. Met/SAM cycle pathway, which consists of 13 metabolic genes, is shown as an example.
-
K
Percentages of pairs of AND genes, OR genes, other paralogs, operon genes, and random metabolic genes categorized as coexpressed using different coexpression values as cutoffs. Coexpression values are based on the gene expression compendium.
-
L
Percentage of random, all pathway, PW, and PO gene pairs categorized as coexpressed using different coexpression values as cutoffs. Coexpression values are based on the gene expression compendium.

