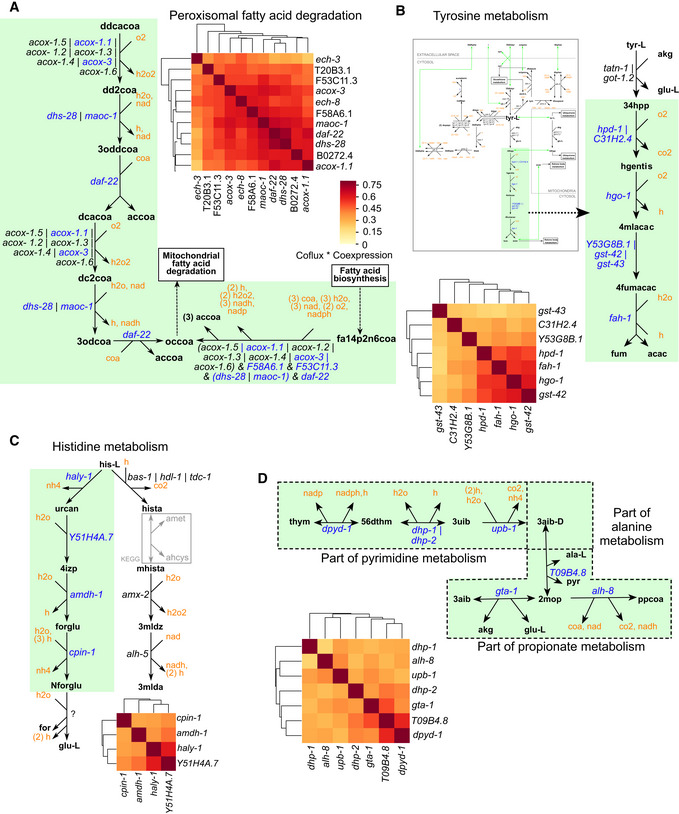
Figure 4. Semisupervised approach defines metabolic pathway boundaries.

- Clustered heatmap denoting a distinct cluster consisting of at least one gene from every reaction in peroxisomal fatty acid degradation. Heatmap genes are shown in bold font. Color legend, indicated here, applies to all panels.
- Clustered heatmap showing a distinct cluster formed by the tyrosine degradation genes separate from the rest of the tyrosine metabolism.
- Clustered heatmap showing a distinct cluster formed by a boundary within the histidine degradation pathway.
- Clustered heatmap showing a distinct cluster formed by genes traversing pathway boundaries that are parts of propionate, alanine, and pyrimidine metabolism.
