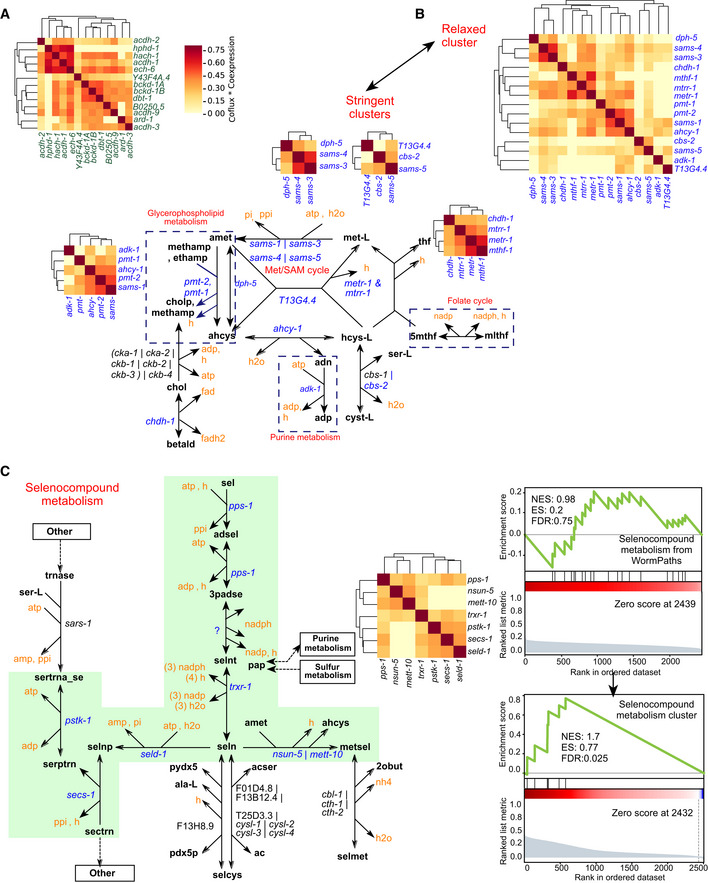
Figure EV5. Semisupervised clustering of product matrix using relaxed parameters.

- Distinct cluster of known coregulated metabolic pathway propionate shunt genes together with isoleucine and valine degradation genes obtained using relaxed clustering parameters (deepSplit = 3, minClusterSize = 6) with the dynamic cut tree algorithm.
- Clusters of Met/SAM cycle genes and genes of related pathways obtained using relaxed (deepSplit = 3, minClusterSize = 6) and stringent (deepSplit = 2, minClusterSize = 3) parameters. Stringent clusters are shown near the drawn pathways of clustered genes.
- Pathway boundary (green shade) within selenocompound metabolism defined by genes in a high‐quality cluster obtained by relaxed parameters and shown by the clustered heatmap (left). Mountain plots showing comparison of self‐enrichment analysis statistics (NES, ES and FDR) of selenocompound metabolism from WormPaths with that of selenocompound cluster obtained by the semisupervised approach (right).
