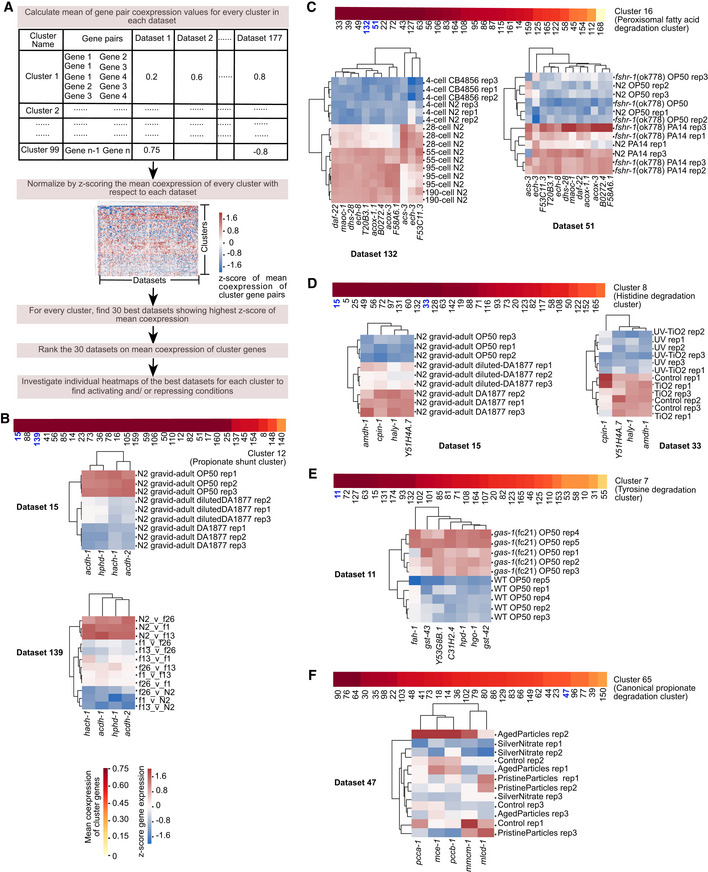
Figure 6. Condition analysis of metabolic gene coexpression.

-
AComputational pipeline to extract activating or repressing conditions of metabolic clusters. The mean coexpression of all gene pairs in each cluster in each dataset is calculated separately. To rank datasets that showed highest coexpression uniquely for each cluster, these mean coexpression values are normalized using z‐scoring across each dataset (as shown by heatmap). Thirty best datasets that potentially represent activation/repression conditions of each cluster are identified by the z‐score values of mean coexpression. Then, for each cluster, datasets are manually inspected in the order of decreasing mean coexpression along with its associated published paper and the heatmap to understand activation/repression conditions.
-
B–FMean coexpression of the 30 best datasets for clusters of propionate shunt (B), peroxisomal fatty acid degradation (C), histidine degradation (D), tyrosine degradation (E), and canonical propionate degradation (F), followed by heatmap examples from selected datasets as indicated by bold‐blue dataset numbers. Color bar and heat map legend as indicated in (B).
