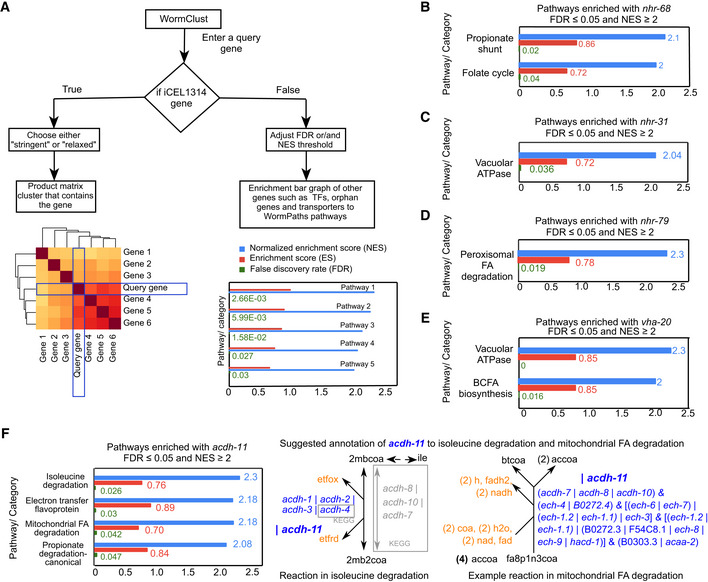
Figure 7. WormClust: a web application that enables querying of genes to identify coexpression with metabolic (sub)‐pathways.

- Diagram showing the workflow of WormClust. A C. elegans gene is taken as input. If the gene is part of iCEL1314, a clustered heatmap of closely associated genes in product matrix of coflux and coexpression is displayed, based on stringency level of clustering. If the input gene is not an iCEL1314 gene, enrichment bar graphs of the gene to annotated metabolic pathways are displayed, based on selected FDR and NES thresholds.
- Bar graph of pathways that are significantly coexpressed with nhr‐68 with NES ≥ 2 and FDR ≤ 0.05.
- Plot showing significant coexpression of nhr‐31 with vacuolar ATPases (FDR ≤ 0.05 and NES ≥ 2).
- Plot showing significant coexpression of nhr‐79 with peroxisomal fatty acid degradation (FDR ≤ 0.05 and NES ≥ 2).
- Plot showing significant coexpression of vha‐20 with vacuolar ATPases (FDR ≤ 0.05 and NES ≥ 2).
- Bar graph of pathways that are significantly coexpressed with acdh‐11 with NES ≥ 2 and FDR ≤ 0.05 (left). Examples of specific reactions in metabolic network model where acdh‐11 can be annotated as OR gene (right).
