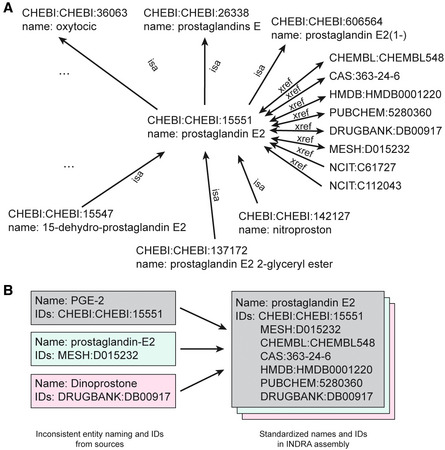
Figure EV2. Ontology graph guiding INDRA knowledge assembly.

- A subgraph of the INDRA ontology graph showing the neighborhood of the node representing “prostaglandin E2” in the ChEBI database (CHEBI: 15551). Edges represent “isa” relationships to more general terms (and from more specific terms), and “xref” edges represent identifier equivalence to nodes representing entries in other databases including MeSH, DrugBank, ChEMBL, CAS, PubChem, and NCIT. Each ontology graph node also provides a name that can be used for standardization and display purposes.
- Example of three entities with inconsistent names and identifiers which, when standardized by INDRA using the ontology graph, are normalized to consistent entities with identical names and sets of identifiers.
