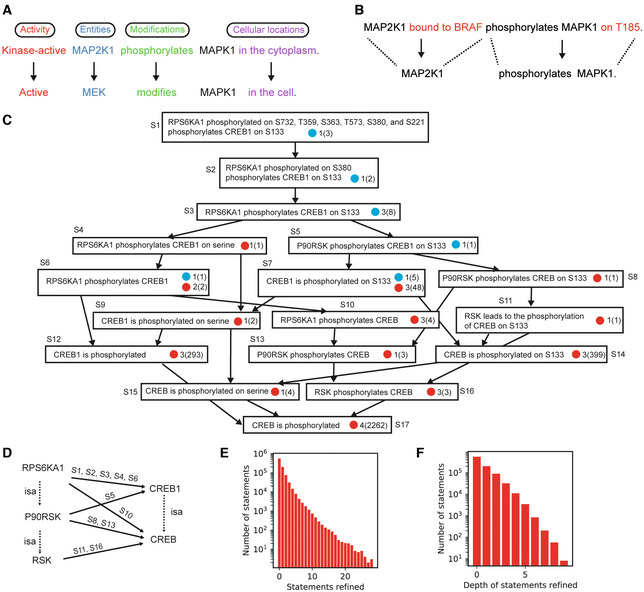
Refinement by hierarchies of Statement elements as defined by INDRA. The two Statements shown contain the same number and types of information but all elements in the top Statement are refinements of the corresponding elements in the bottom Statement according to the INDRA Statement hierarchies.
Refinement by additional context. The upper Statement contains all information in the lower one but also provides additional detail, making it a refinement of the one below.
Example refinement graph for a Statement from the example corpus. For clarity, the transitive reduction of the hierarchy is shown, and each Statement object is displayed via its English language equivalent. Each node in the graph represents a statement with blue or red circles representing evidence from pathway databases or mentions extracted by machine reading systems, respectively. Next to each blue or red circle, the number of different sources is shown with the overall number of mentions from these sources in parentheses. For example, the statement “CREB1 is phosphorylated on S133” has five pieces of evidence from one pathway database source, and 48 mentions extracted by three reading systems. Edges represent refinement relationships and point from more specific to less specific Statements.
Graph of family relationships (dotted isa edges) and Statements representing phosphorylation (solid edges, annotated with Statement identifiers from panel C), between different levels of specificity of the RSK and CREB protein families.
Number of Statements based on the total number of other Statements that they refine.
Number of Statements with different depths of Statements that they refine (i.e., the length of the longest path in the graph of refinement relations starting with the given Statement).

