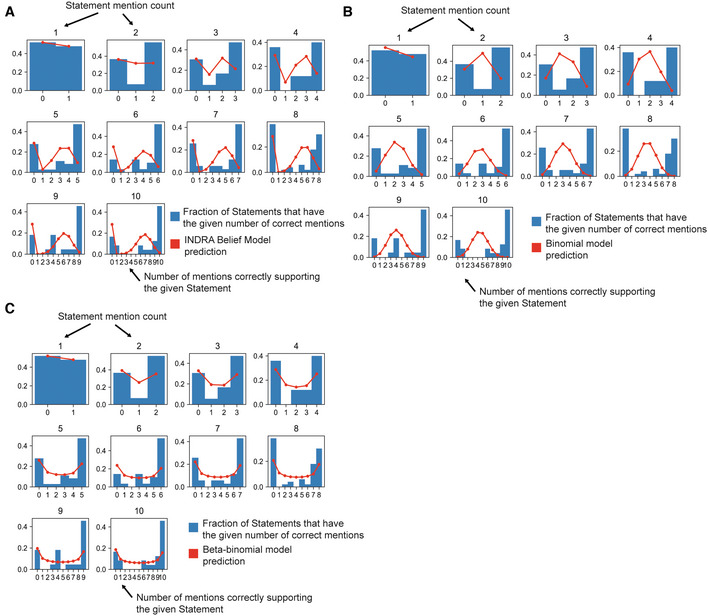
Figure EV3. Observed and predicted distributions of mentions correctly extracted by Reach for Statements supported by up to 10 Reach mentions.

- Frequencies of correct mentions predicted by the INDRA Belief Model. The blue bars in each subplot show the frequencies of statements with k correctly extracted mentions for n total mentions for the Statement (considering mentions from the Reach reader only). The red line in each subplot shows the frequencies of correct mentions expected by the INDRA Belief Model. The INDRA Belief Model expects a substantial proportion of Statements to have an intermediate number of correctly extracted mentions, whereas the empirical data suggests that Statements are more likely to be associated with mentions that are either all correct or incorrect.
- Frequencies of correct mentions expected by the Binomial model. Blue bars are identical to (A).
- Frequencies of correct mentions expected by the Beta‐binomial model. Blue bars are identical to (A) and (B). The Beta‐binomial model differs from the INDRA Belief Model and Binomial models in that it predicts relatively greater proportions of Statements with mentions that are either all correct or incorrect.
