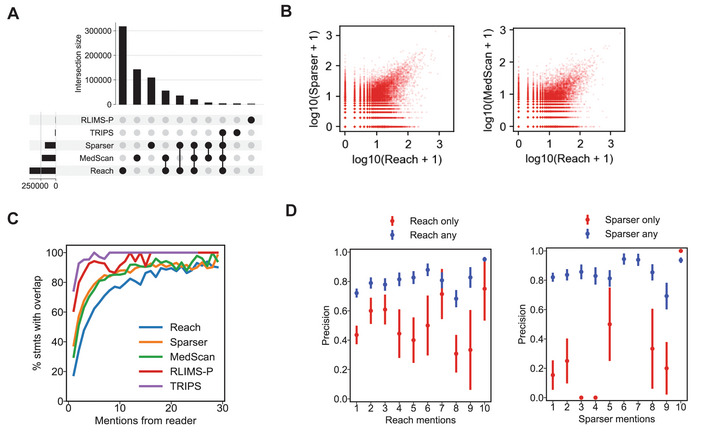
Figure 5. Estimating Statement belief with multiple machine readers combined.

- Upset plot (equivalent to a Venn diagram with more than three sets) of Statement support for five machine reading systems integrated by INDRA. For a given Statement, two or more readers intersect if they each provide supporting mentions for it. The top 10 subsets are shown; for a full upset plot of all subsets, see Fig EV4A.
- Number of mentions from Reach and Sparser (left) and Reach and MedScan (right) for a given Statement, each Statement being represented by a red dot. Mention counts are plotted on a logarithmic scale.
- The percentage of Statements for which an intersection (i.e., any overlap) between reading systems is observed as a function of the number mentions from a given reader; the data are plotted separately for each of the five reading systems.
- Empirical Statement precision as a function of the number of mentions from Reach (left) and Sparser (right), plotting the cases for which only Reach or Sparser provides supporting mentions for a Statement (red) and the case where all Statements are taken into account (blue).
