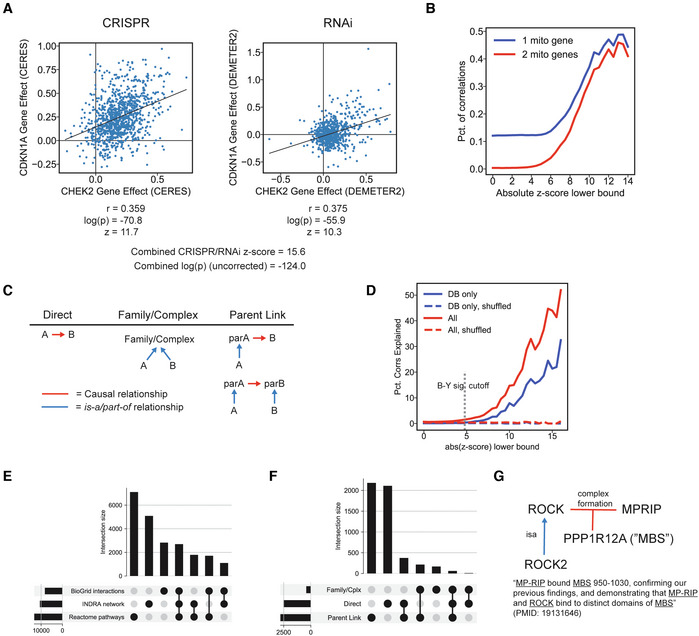
CRISPR (left) and RNAi (right) data from DepMap showing the codependency of the CHEK2 and CDKN1A genes across a panel of cancer cell lines (each blue dot represents a cell line, placed according to normalized cell viability change upon gene perturbation). Black lines show the linear regression plot over the cell line viability values.
Percent of gene codependencies (i.e., correlations) involving one or two mitochondrial genes as a function of the absolute z‐score corresponding to the codependency.
Patterns of network nodes and edges that constitute an “explanation” for an observed DepMap codependency, including “Direct” (a direct edge between two specific genes A and B), “Family/Complex” (two genes A and B are part of the same family or complex), and “Parent Link” (where one or both of the specific genes A and B are related via a parent family/complex they are part of).
Percent of codependencies/correlations explained using the INDRA network when considering all edges (red) or only edges supported by curated databases, excluding text mining (blue), with randomly shuffled controls shown.
Upset plot showing the intersection of explanations for DepMap codependencies provided by three networks: BioGRID interactions, the INDRA network, and Reactome pathways.
Upset plot showing the intersection of three types of explanation for DepMap codependencies provided by the INDRA Network, corresponding to explanation patterns shown in panel (C).
An example explanation for the codependency between ROCK2 and MPRIP derived from the INDRA network. INDRA provides evidence for a complex in which ROCK (the protein family of which ROCK2 is a member) binds MPRIP in a three‐way complex with PPP1R12A (also called MBS) through the mention shown at the bottom (extracted from Wang
et al,
2009a; Wang
et al,
2009b).

