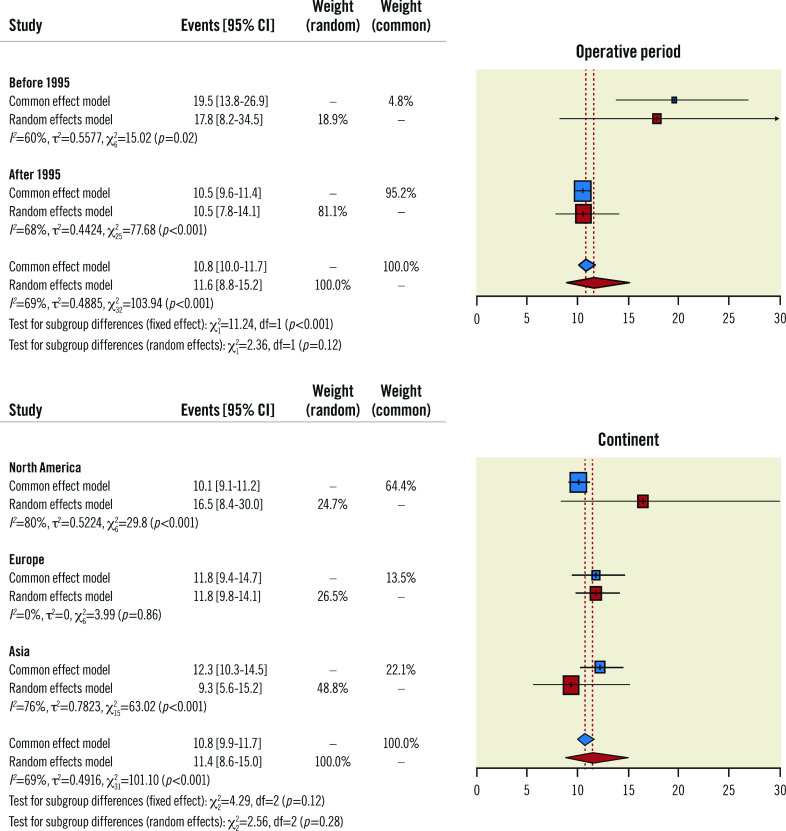
Figure 3. Subgroup meta-analysis.
Forest plot of subgroup meta-analysis investigating the impact of the operative period* and continent# on the primary endpoint. * The studies by Iscan et al and Di Mauro et al were excluded because of their operative period. #Africa (n=1) and Oceania (n=2) were excluded because of their underrepresentation. CI: confidence interval

