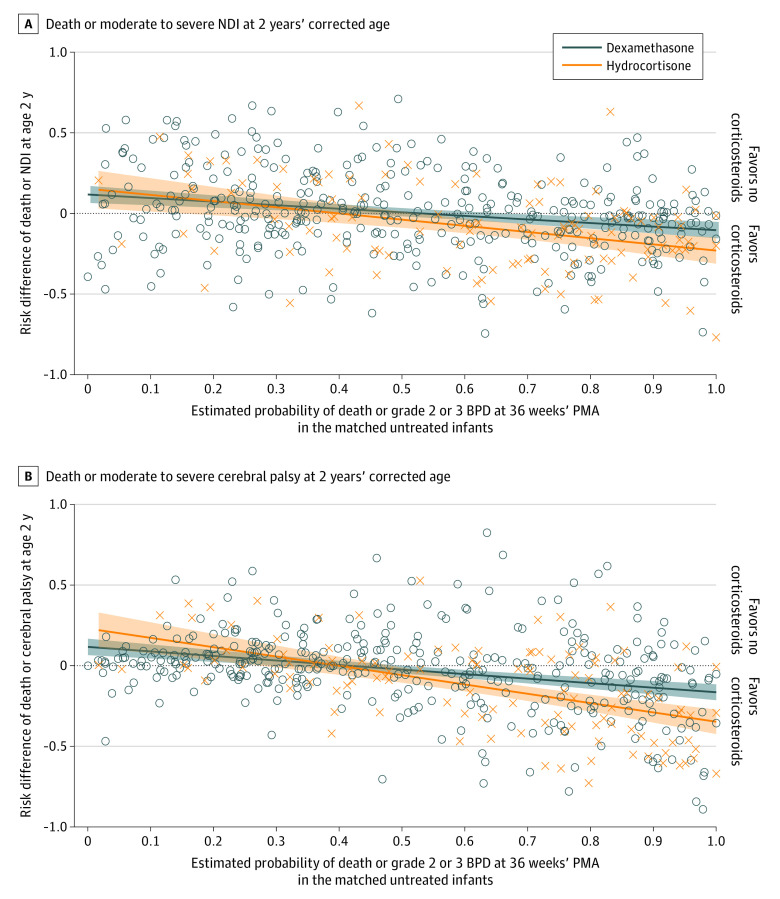
Figure 3. Risk Differences for Death or Disability Stratified by Treatment With Dexamethasone or Hydrocortisone.
Circles and Xs represent values computed for individual matched pairs with dexamethasone and hydrocortisone treatment, respectively; shaded areas represent regression lines and 95% CIs. The regression line for death or neurodevelopmental impairment (NDI) is y = 0.131 – 0.221x for dexamethasone and y = 0.167 – 0.384x for hydrocortisone. For dexamethasone, the regression line crosses the x-axis at a pretreatment probability of death or grade 2 or 3 bronchopulmonary dysplasia (BPD) of 59% (95% CI, 48%-74%) for dexamethasone and 44% (95% CI, 21%-56%) for hydrocortisone. The regression line for death or cerebral palsy crosses the x-axis at 42% (95% CI, 31%-50%) for dexamethasone and 40% (95% CI, 28%-48%) for hydrocortisone. PMA indicates postmenstrual age.

