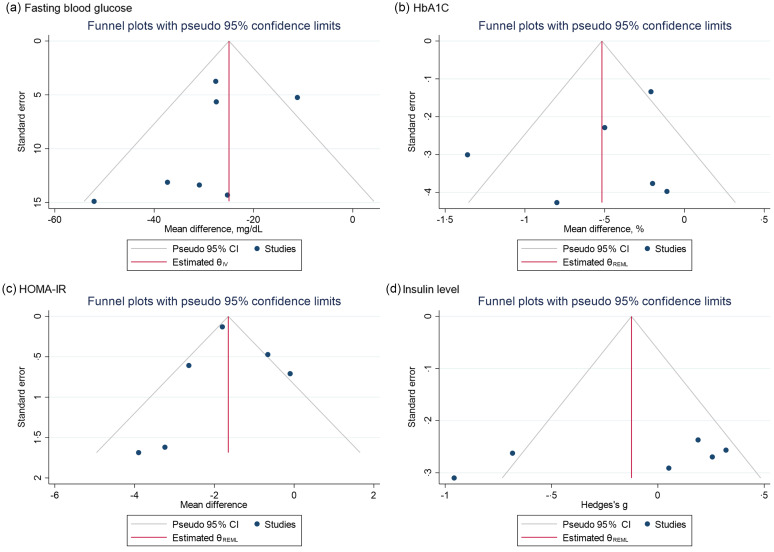
Fig. 4.
Funnel plots with pseudo 95 % CI demonstrating the MD or SMD of post-trial fasting blood glucose (a), HbA1c (b), HOMA-IR (C) and serum insulin level (d) for each low risk-of-bias trials against their corresponding SEs. MD, mean difference; SMD, standardised mean difference; HOMA-IR, homeostatic model assessment for insulin resistance.

