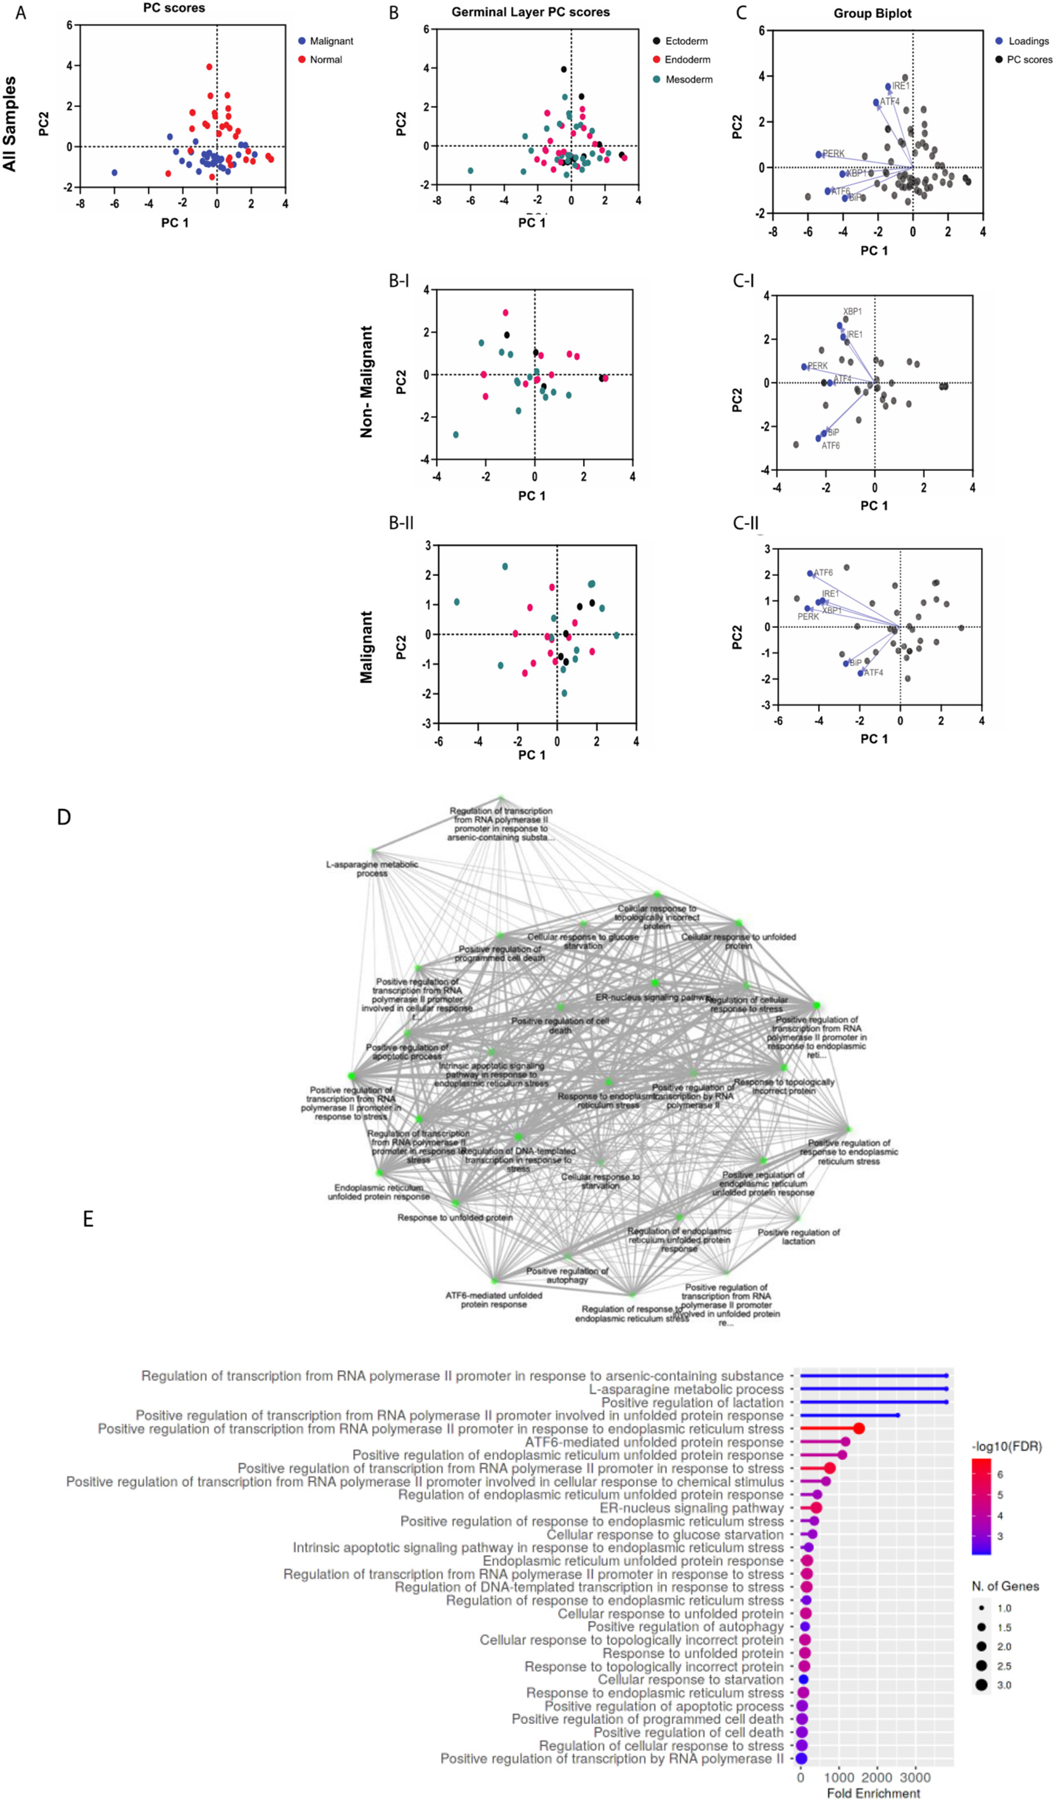
Fig. 3.

Principal Component Analysis of UPR genes. Gene expression data from The Cancer Genome Atlas (TCGA) was accessed through GEPIA (http://gepia.cancer-pku.cn). Gene expression levels are the median of the cohort, and both tumor samples and matched normal samples were analyzed. (A) PC score plot for malignant versus normal samples (normal samples = red dots; malignant samples = blue dots). PC score plots for non-malignant (B–I) and malignant (B-II) samples based on embryological origin (germinal layer; ectoderm = black dots, endoderm = red dots, mesoderm = green dots). Biplots with PC scores (black dots) and loadings (blue dots) for genes from non-malignant (C–I) and malignant (C-II) samples. Gene ontology enrichment analysis was performed on each gene list to verify that the gene signatures represented UPR pathways (Shiny GO v0.741; bioinformatics.sdstate.edu) (D and E).
