
Fig 1. Nedd4L levels are reduced in fibrotic lungs and myofibroblast cells.
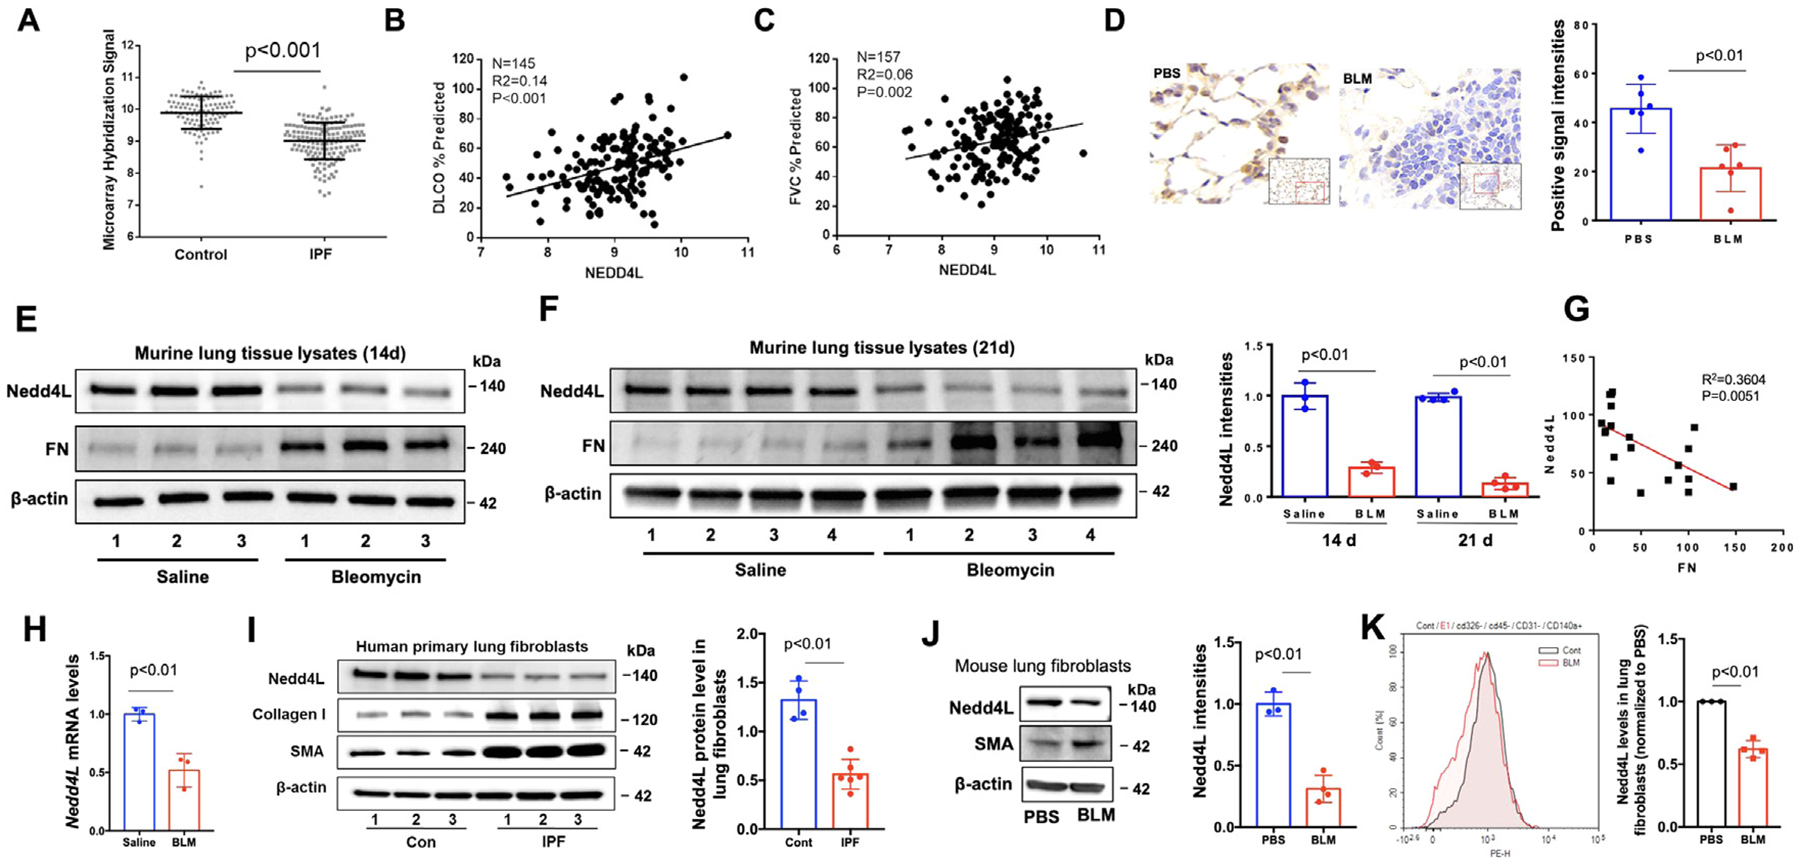
A. Nedd4L mRNA levels in controls (n=108) compared to IPF group (n=160). Mann Whitney test, P<0.001. B. Expression of Nedd4L in arbitrary units as a function of diffusing capacity of carbon monoxide (DLCO)% predicated (IPF patients, n=145). C. Expression of Nedd4L in arbitrary units as a function of FVC% predicated. (IPF patients, n=157). D. IHC staining of Nedd4L in lung tissues from IT PBS and IT bleomycin (BLM)-challenged mice. Nedd4L positive intensities were analyzed by Image J. E.F., Immunoblotting analysis of lung tissues of BLM-challenged mice. Nedd4L intensities were analyzed by Image J (n=3−4). G. A negative correlation between expression of Nedd4L and FN in lung tissues from BLM-challenged mice. H. Nedd4L mRNA levels from lungs of IT PBS- or IT BLM (2 U/kg, 14 d)-challenged mice were examined by realtime PCR. I. Representative immunoblots of lung fibroblasts from normal control subjects and IPF patients. Nedd4L intensities were analyzed by Image J (n=4−6). J. Representative immunoblots in isolated lung fibroblast cells from IT PBS and IT BLM-challenged mice (n=3−4). K. Flow cytometry analysis of Nedd4L in isolated lung fibroblasts (cd326−/cd45−/cd31−/cd140a+) from IT PBS (cont)- or IT BLM-challenged mice. Gray: Cont; red: IT BLM-treated cells. Shown are representative flow cytometry histograms. n=3−4, P<0.01.