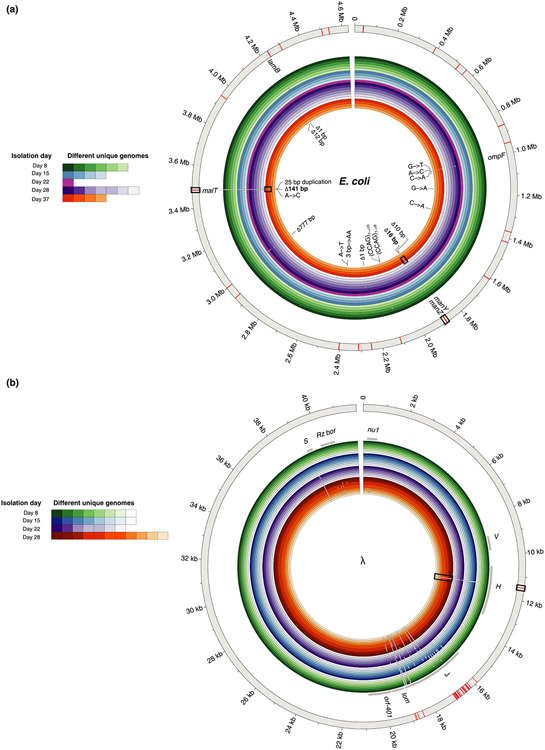
FIGURE 3.
Genomic diversity in clones isolated from different days and whole population sequencing for (a) Escherichia coli and (b) λ. The outermost grey ring represents the reference genome. The inner coloured rings represent the isolates sequenced from different time points (outer rings are genomes isolated from earlier time points). Shades within each colour depict unique genomes sequenced from each time point. White gaps in the genomic rings indicate the location of mutations. All 18 unique mutations found in clonal isolates have been labelled for E. coli in (a); however, due to the large number of mutations in λ, only the gene names that harbour mutations from clonal isolates have been identified (grey bars). Note that white gaps corresponding to mutations are larger than a single base, so occasionally a single gap represents multiple adjacent mutations. The red bars in the outermost grey ring indicate the placement of mutations uncovered by the whole population sequencing at day 8. The mutations that become dominant at later stages of coevolution and were also found in day 8 population sequencing have been highlighted with rectangular boxes

