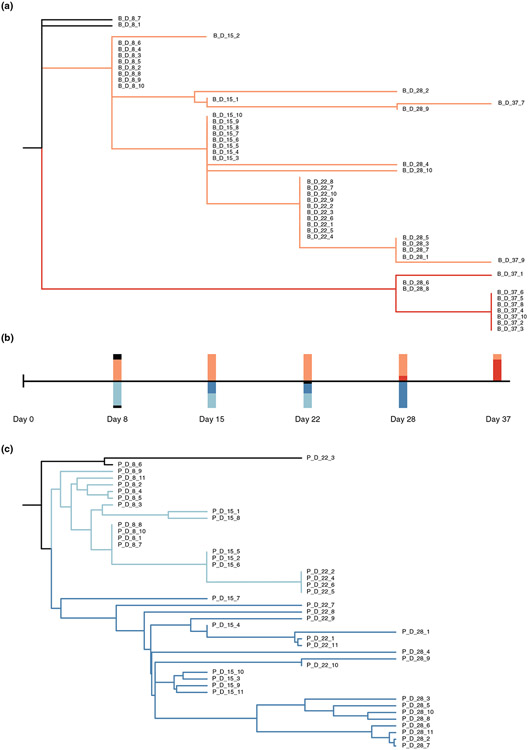
FIGURE 4.
Reconstructed phylogenetic trees of the host and phage. (a) The host phylogenetic tree based on host mutation profiles. All completely resistant host strains are located on the red branch. Bars above the time scale in (b) represents the proportion of host strains from each coloured branch across different checkpoints. (c) The phage phylogenetic tree based on the phage mutation profiles. All day 28 phage strains are located on the dark blue branch. Bars below the time scale in (b) represents the proportion of phage strains from each coloured branch across different checkpoints

