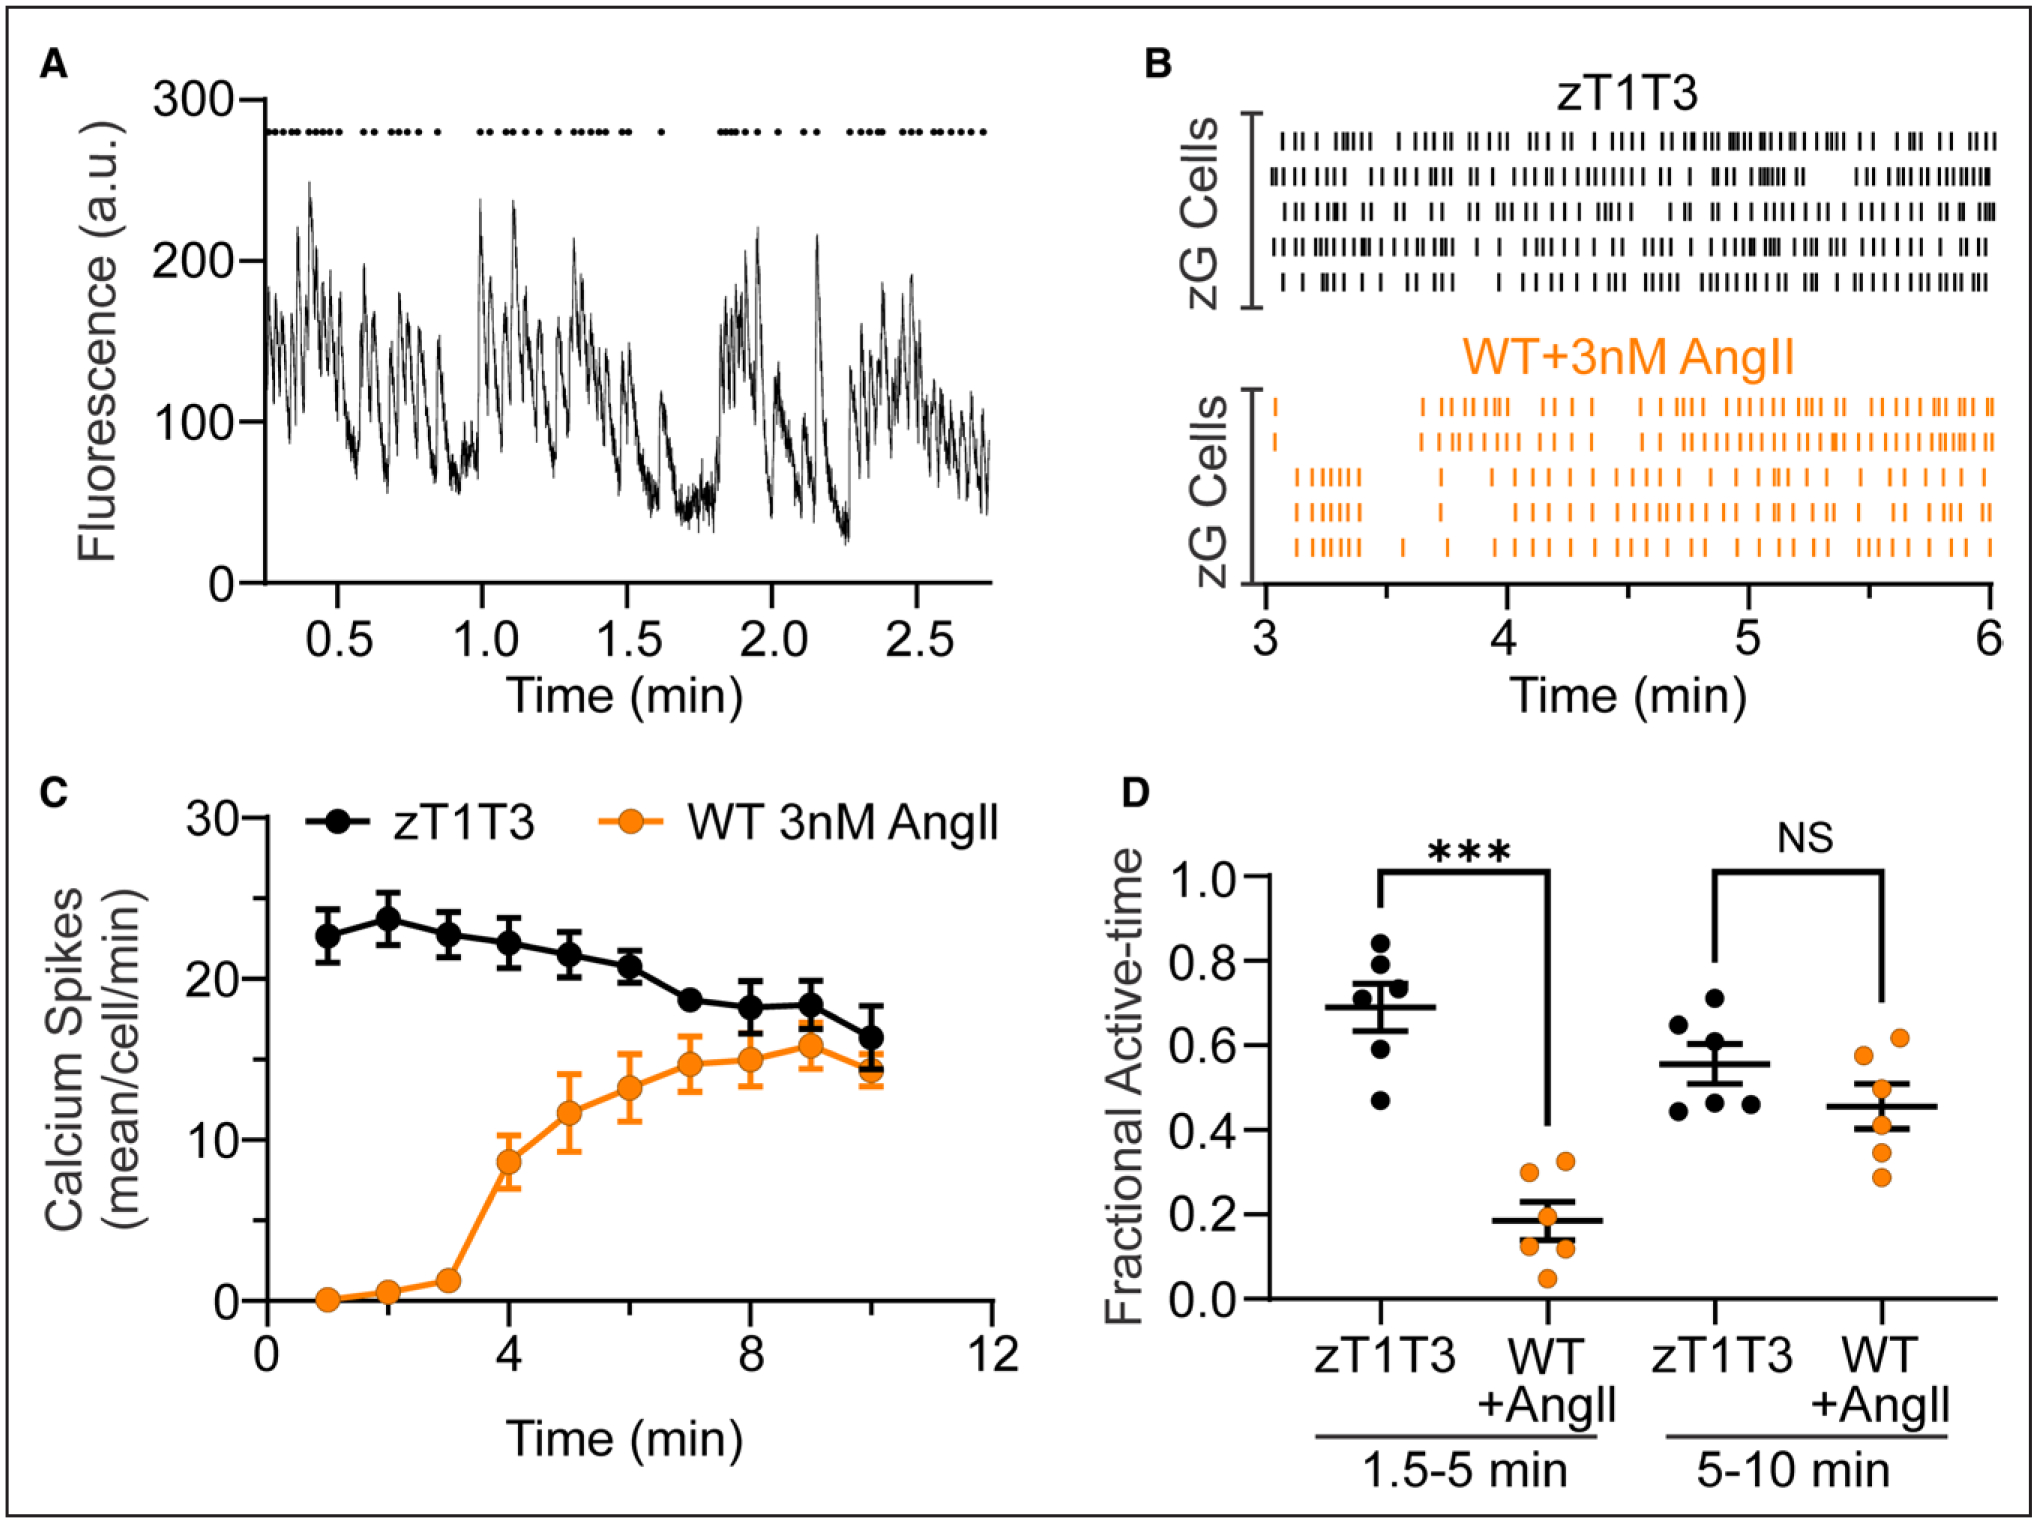
Figure 1. TWIK-related acid-sensitive potassium channel (TASK) channel LOF results in robust, spontaneous calcium oscillations, comparable to that elicited by AngII in WT slices.

A, A representative trace (A, bottom) of GCaMP3 florescent intensity over time. Mean pixel intensity of each region of interest (ROI) from a zG-TASK-LOF (zT1T3) adrenal slice, and the corresponding raster plot (A, top) highlighting the timing of each individual calcium spike. B, Representative raster plots of zG calcium spikes in zG-TASK-LOF (B, top; black lines; spontaneous activity) and WT slices (B, bottom; orange lines, evoked-activity, 3 nM AngII [angiotensin II] added at 1.5 minutes). C, Number of calcium events per cell in 1 minute bins from WT (3 nM AngII at 1.5 minutes, n=6 mice) and zG-TASK-LOF (spontaneous activity, n=6 mice) slices. D, Fraction of time in which zG cells were active is significantly less early in the recording (1.5–5 minutes, ie, during baseline and early AngII-stimulation) in WT (n=102 cells from mice) compared with spontaneous activity in zG-TASK-LOF slices (n=103 cells from 6 mice). WT activity attains that of zG-TASK-LOF in the second half of the recording (5–10 minutes), as AngII-elicited activity reaches maximal response. Data are expressed as mean±SEM; black symbols: zG-TASK-LOF slices, orange symbols: WT slices; ***P<0.001 or NS (nonsignificant) by linear mixed model with Bonferroni’s multiple comparisons test.
