
Figure 1.
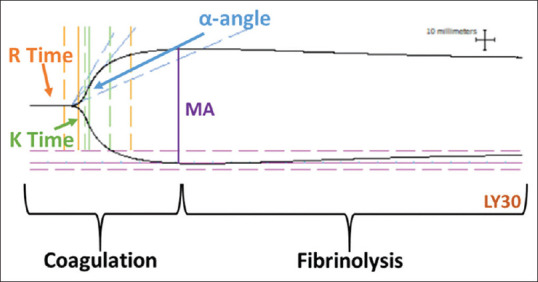
A typical blood coagulation and fibrinolysis curve obtained from thromboelastography analysis of blood samples. Various quantitative parameters used to measure the clotting cascade are indicated on the relevant parts of the curve
Official websites use .gov
A
.gov website belongs to an official
government organization in the United States.
Secure .gov websites use HTTPS
A lock (
) or https:// means you've safely
connected to the .gov website. Share sensitive
information only on official, secure websites.
A typical blood coagulation and fibrinolysis curve obtained from thromboelastography analysis of blood samples. Various quantitative parameters used to measure the clotting cascade are indicated on the relevant parts of the curve