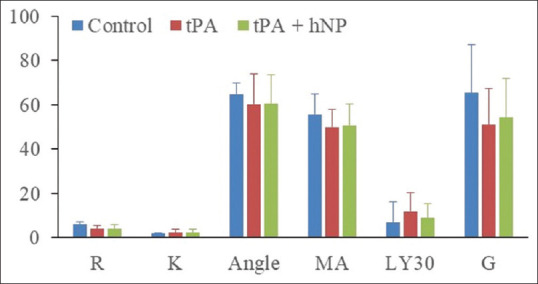
Figure 2.

A bar graph of the measured parameters from control and tPA-added blood samples without and with hemostatic nanoparticle treatment. Compared to control samples, rate of clot formation (Angle) and clot strength (g) showed a trend toward decrease, but not statistical significance in tPA and in tPA + HNP samples. Units of measurements for the parameters are explained in the methods. tPA: Tissue plasminogen activator, hNP: hemostatic nanoparticle
