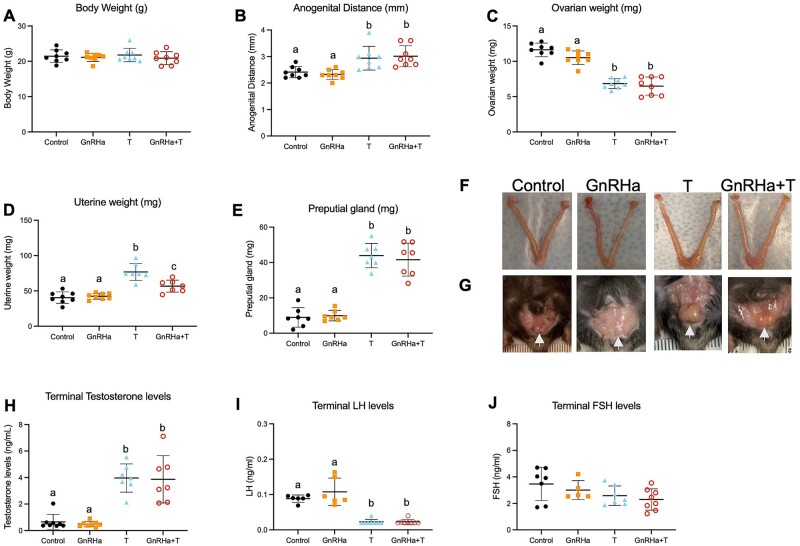
Figure 4.
Body measurement and hormones levels of GnRHa+T-treated animals. (A) Body weight, (B) anogenital distance, (C) paired ovarian weight, (D) uterine weight, (E) preputial gland weight and (F) Terminal T, (G) LH and (H) FSH levels in control, GnRHa-only, T-only and GnRHa+T mice. (I) Representative ovarian, uterine and (J) preputial gland images from control, GnRHa-only, T-only and GnRHa+T animals. Data are expressed as mean + SD, ANOVA followed by Tukey test; letters (a, b, c) denote significance.

