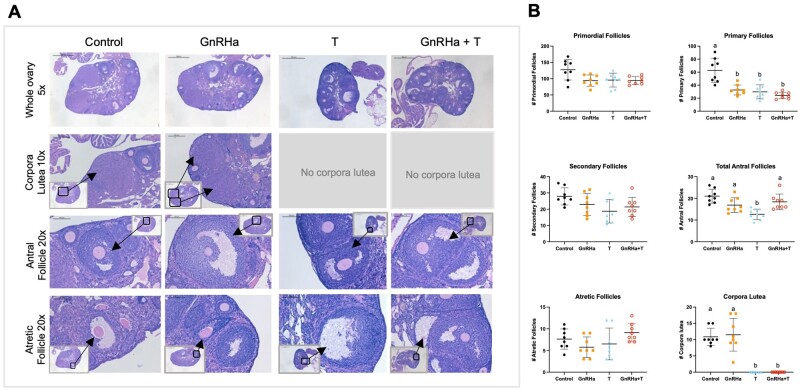
Figure 5.
Ovarian histology and follicle counts of GnRHa+T-treated animals. (A) Representative comparison of hematoxylin and eosin-stained ovaries from controls, GnRHa-only, T-only and GnRHA+T-treated mice at different time points. (B) Numbers of primordial, primary, secondary, total antral and atretic follicles, and corpora lutea counts in controls, GnRHa-only, T-only and GnRHA+T-treated mice at different time points. Data expressed as mean + SD, ANOVA followed by Tukey test; letters (a and b) denote significance, P < 0.05.

