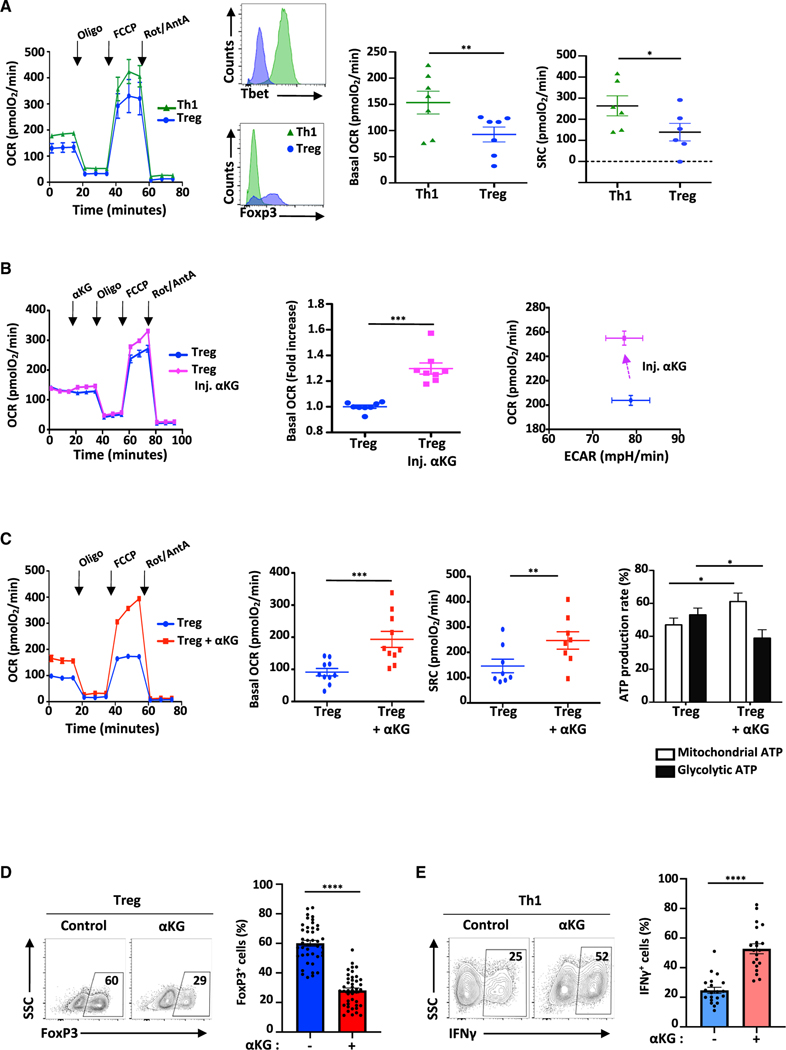
Figure 1. αKG-induced increases in OXPHOS are associated with decreased Treg polarization and augmented Th1 differentiation.
(A) OCR was monitored at day 4 of Th1 and Treg polarization following sequential injection of oligomycin, FCCP and rotenone/antimycin A (arrows; left panel). The differentiation status of Th1- and Treg-polarized cells was monitored by Tbet and FoxP3 expression and representative histograms are shown (n = 7). Mean basal OCR levels ± SEM (n = 7 independent experiments) and SRC (n = 6) are presented.
(B) The direct impact of αKG on cell metabolism was evaluated by injecting αKG into the XFe96 flux analyzer at day 2 of Treg polarization and fold change in basal OCR as well as OCR/ECAR energy plots ± SEM are shown (n = 8).
(C) OCR of CD4 T cells activated under Treg-polarizing conditions ± αKG (day 4) are presented (n = 1 of 10). Quantification of basal OCR ± SEM (n = 8) and SRC (n = 8) are shown. The percentage of the ATP production rate derived from mitochondrial and glycolytic pathways are presented as means ± SEM (n = 7).
(D) FoxP3 expression was evaluated following stimulation of naive CD4 T cells under Treg-polarizing conditions in the absence (control) or presence of αKG (day 4). Representative plots and means ± SEM are presented (right, n = 42).
(E) IFNγ expression by naive CD4 T cells stimulated under Th1-polarizing conditions was evaluated by flow cytometry and means ± SEM are presented (n = 20). Statistical analyses were evaluated by paired (A and C) and unpaired (D and E) 2-tailed t tests.

