Figure 5.
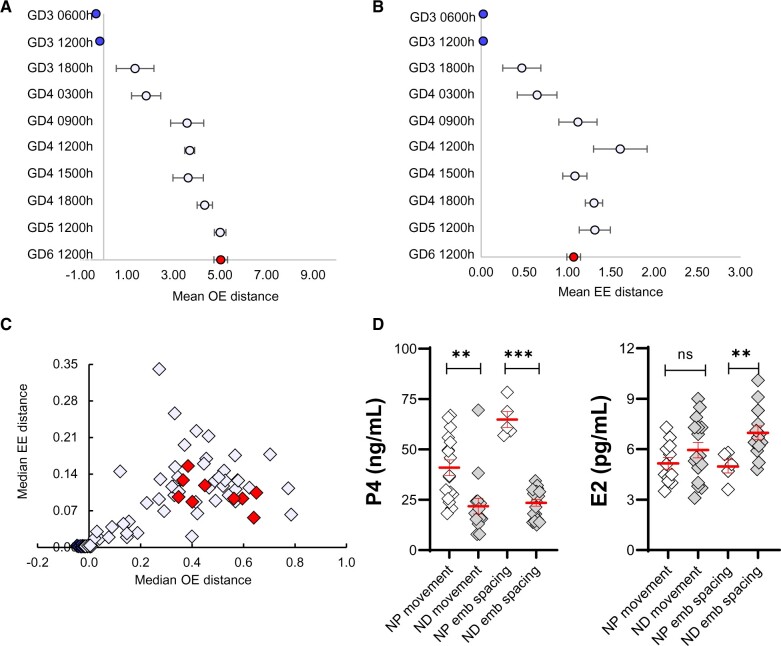
Embryo movement pattern and serum hormone levels in a lactational natural diapause pregnancy differ from a natural pregnancy in mice. (A) Mean OE distance and (B) Mean EE distance, with whiskers representing standard error for embryo location (from Fig. 4) and is color-matched for GD. (C) OE versus EE analysis of embryo location (data from Fig. 4). Each diamond represents the median value from individual uterine horns (from Fig. 4) and is color-matched for GD. (D) Comparison of serum P4 and E2 in NP and ND. Time points are combined, and hormone levels are compared during the movement phase or after embryo spacing. P4 levels are lower both during embryo movement and spacing. E2 levels in ND pregnancy are similar to NP at the start of embryo movement but are significantly higher than NP during embryo spacing. Mean ± SEM displayed in red. ns: not significant, **P < 0.01, ***P < 0.001. For serum hormone levels, the unpaired two-tailed Student’s t-test was performed with Welch’s correction. OE: oviduct-embryo distance; EE: embryo-embryo distance; GD: gestational day; ND: natural diapause; P4: progesterone; E2: estrogen.

