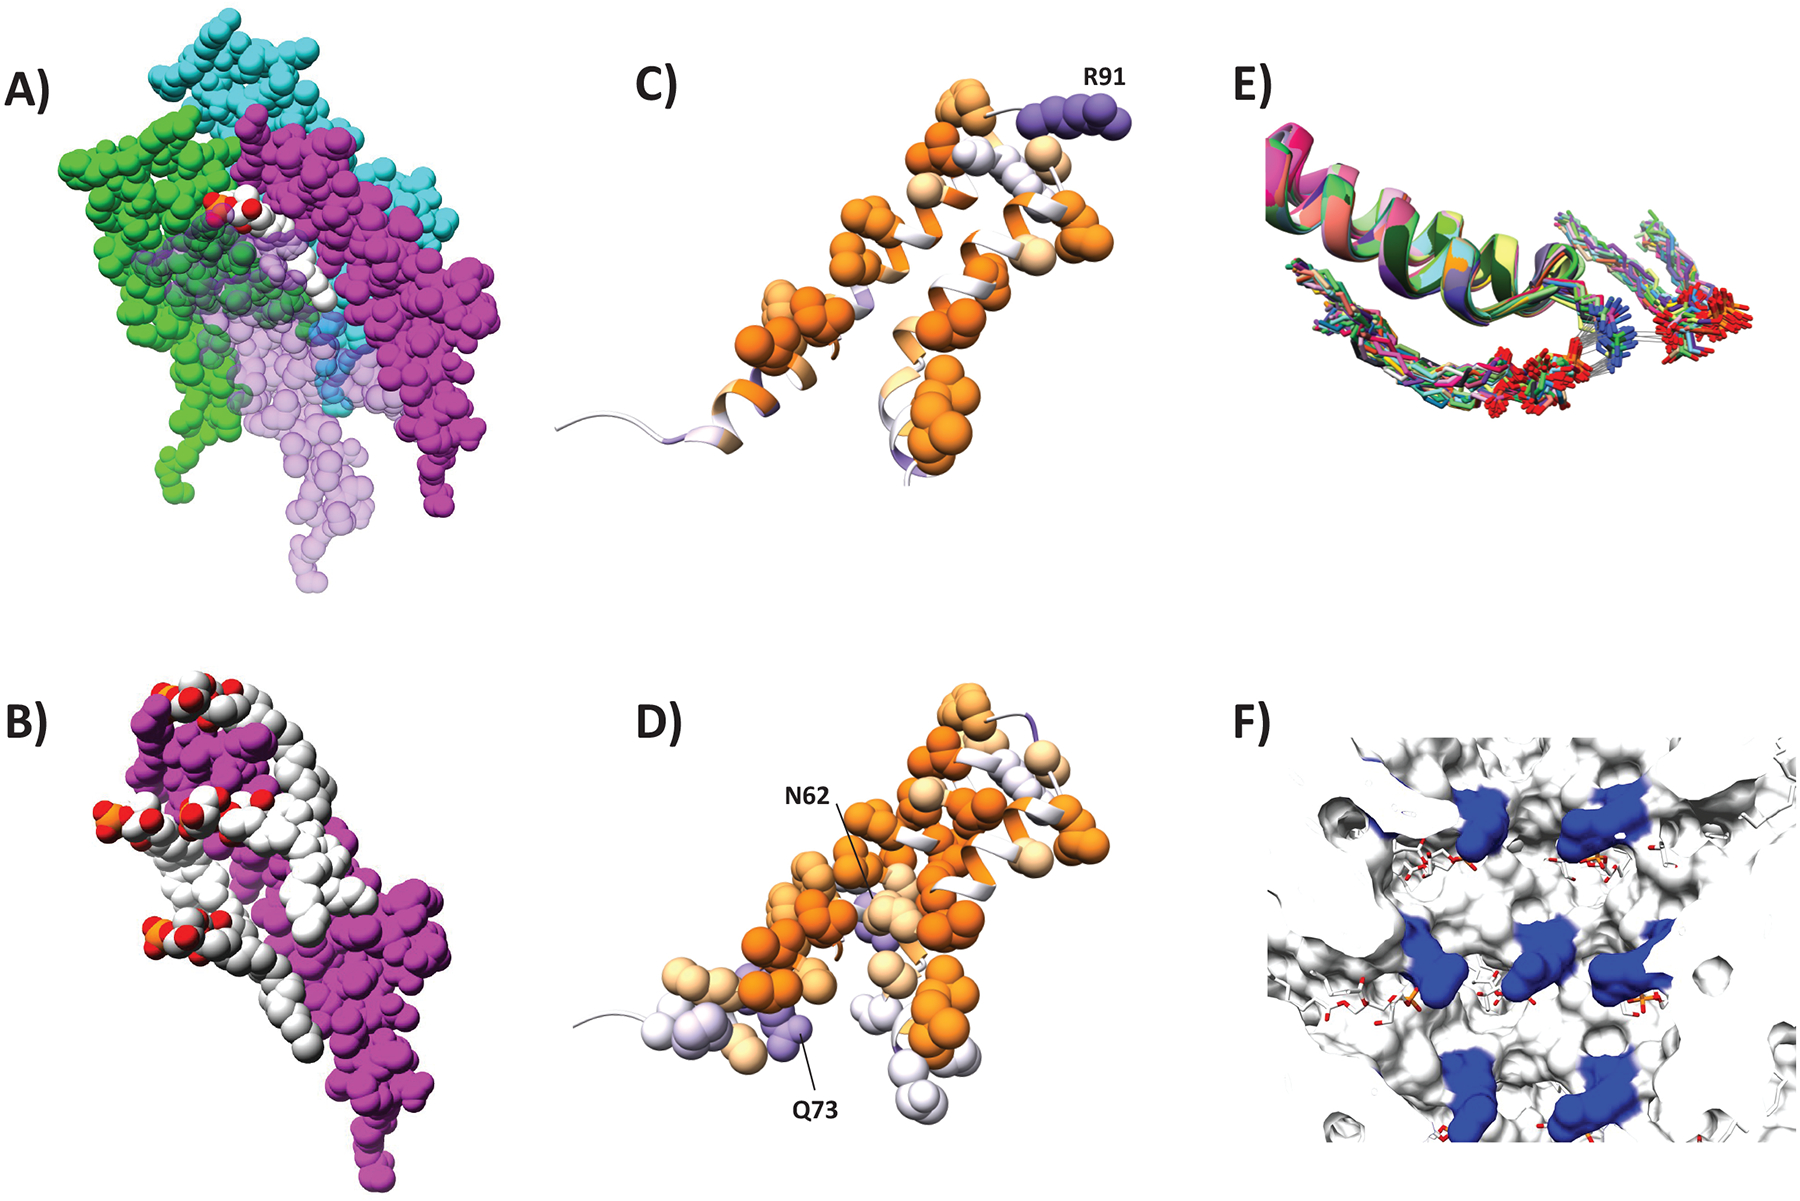
Figure 4. Interaction network between virB2 monomers and lipid molecules.

Space filling models showing that (A) each PG molecule (white) interacts with four VirB2 protomers (purple, cyan, green and light pink) and (B) each VirB2 protomer (purple interacts with four PG molecules (white and light gray). VirB2 Interface involved in (C) protein-lipid or (D) protein-protein interaction, colour-scaled by hydrophobicity (purple: hydrophilic, orange: hydrophobic). (E) Flexibility of Arg 91 as determined by MD simulations showing that it is possible for Arg 91 sidechains to interact with two lipidic head groups by electrostatic interaction and hydrogen bonds. 30 unfixed molecules from two independent MD simulations are overlayed. Gray lines indicate hydrogen bonds between lipids and VirB2 protomers. (F) View of the pilus lumen showing Arg 91 (blue) and phospholipids (white/red).
