FIGURE 1.

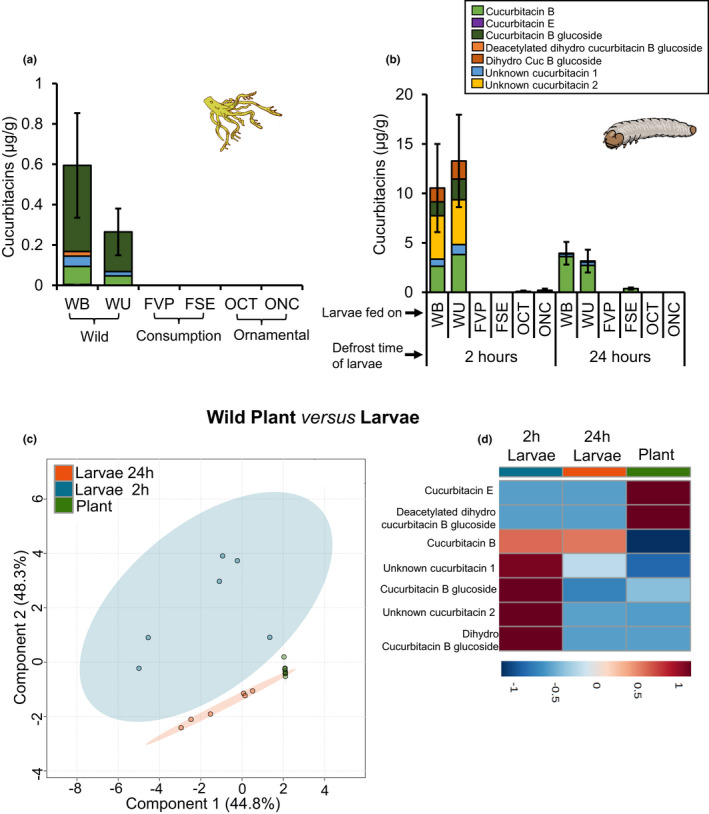
Differences in cucurbitacins profiled in C. argyrosperma roots and D. balteata larvae. (a) Cucurbitacin levels in squash roots (n = 4) of 2‐week‐old plants of wild populations (WU and WB), consumption (FVP and FSE) and ornamental varieties (OCT and ONC). (b) Cucurbitacin content in 2 and 24 h defrosted larvae (n = 3) that fed on roots of wild plants, consumption and ornamental varieties for 7 days. Bars represent the mean (±SE). (c) Results of a discriminant analysis (PLS‐DA) and (d) hierarchical clustering heatmaps of the cucurbitacins present in roots of squash and larvae that fed on these roots. Different letters indicate significant differences between treatments within each time point (p values are given for treatments [generalized linear model (family, Gaussian)] followed by pairwise comparisons of least squares means (LSMeans). **p < 0.01, ***p < 0.001
