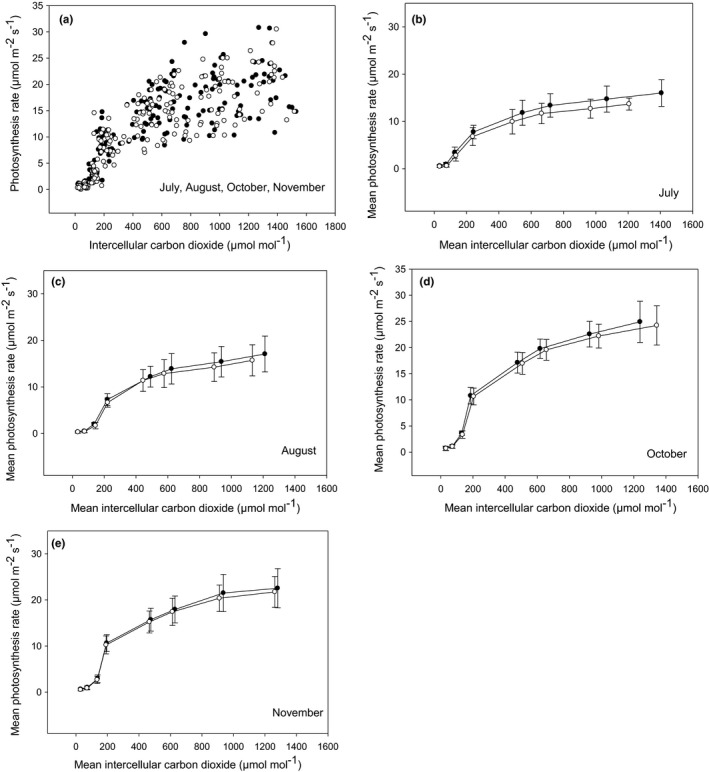
FIGURE 1.

The response of maximum photosynthesis (A; µmol m−2 s−1) to intercellular CO2 (C i; µmol mol−1) of attached (closed circles) and detached balsam fir foliage (open circles) assessed in July through to November 2019 (a). The mean monthly response ±the standard deviation (error bars; panels b–e
