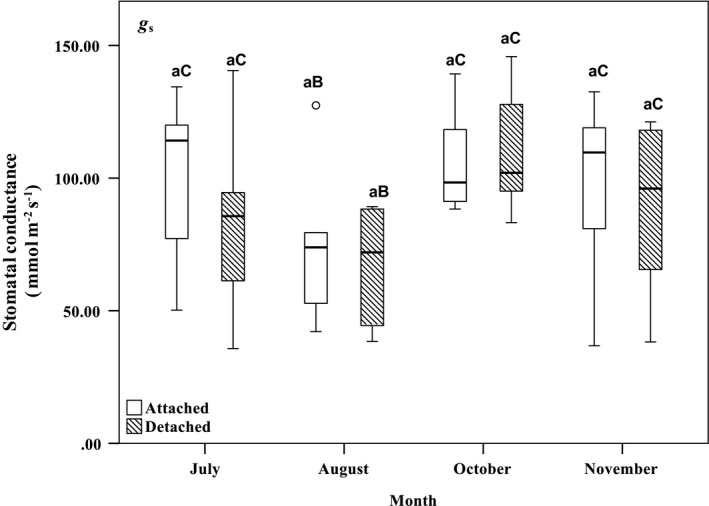
FIGURE 4.

Box plots of mean stomatal conductance (g s; mmol m−2 s−1) of attached and detached balsam fir foliage assessed in July through to November 2019, varying C ref from 50 to 1800 µmol mol−1. The thick horizontal lines in the boxes represent the median of plotted values. See Figure 2 for box‐plot descriptions. Similar lowercase letters indicate no significant difference regarding branch status (p > 0.05). Differences in uppercase letters indicate significant differences regarding measurement month (p < 0.05). Comparisons were made in relation to reference values for branch status and measurement month
