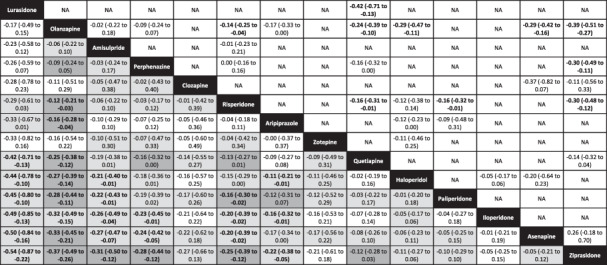
Table 1.
League table for the change in overall symptoms (primary outcome)
|
|
The left lower field presents the results of the network meta‐analysis; the right upper field presents the results of pairwise meta‐analyses. Treatments are in order of their point estimate compared to olanzapine. Each cell provides the standardized mean difference and the corresponding 95% confidence interval (CI) of a comparison (treatment in column vs. treatment in row for the network meta‐analysis; treatment in row vs. treatment in column for the pairwise meta‐analysis). Bold prints indicate 95% CIs excluding opposite effects. Please note that in Figure 2 olanzapine was always the reference, which explains why in that figure and in the text the sign of all comparisons with olanzapine was always + except for lurasidone. For the results of the network meta‐analysis, the background colors of the cells reflect confidence in the estimates, with dark grey representing moderate confidence, light grey low confidence, and white very low confidence. NA – not available.

