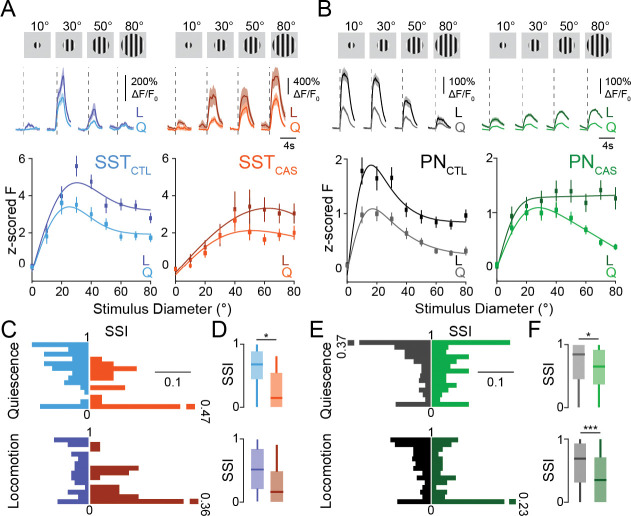
Figure 2. VIP interneuron ablation alters the size tuning properties of SST-INs and PNs.
(A) Upper: Responses of example SST-INs to drifting grating stimuli of varying sizes in a control (left, blue; SSTCTL) and a VIP ablation animal (right, orange; SSTCAS). Vertical dashed lines indicate visual stimulus onset. Responses during quiescence (Q, light traces) are shown separately from those during locomotion (L, dark traces). Shaded areas indicate mean ± SEM. Lower: Visual responses of SST cells z-scored to the 1s baseline period before the stimulus onset for periods of quiescence (Q, light lines) and locomotion (L, dark lines) for control (blue) and VIP ablation animals (orange). (B) Same as in A, but for PNs in control (gray; PNCTL) and VIP ablation (green; PNCAS) animals. (C) Probability distribution of the surround suppression index (SSI), separated by locomotion state, for SST-INs in control (blue; Quiescence (upper): n = 86 cells, 6 mice; Locomotion (lower): n = 101 cells, 6 mice) and VIP-ablation animals (orange; Quiescence (upper): n = 36 cells, 4 mice; Locomotion (lower): n = 30 cells, 4 mice). (D) Boxplot of the SSI during quiescence (upper) and locomotion (lower). (E-F) Same as in C-D but for PNs in control (gray; Quiescence (upper): n = 279 cells, 6 mice; Locomotion (lower): n = 314 cells, 6 mice) and VIP ablation (green; Quiescence (upper): n = 175 cells, 5 mice; Locomotion (lower): n = 165 cells, 5 mice) animals. *p<0.05, ***p<0.001, 0/1 inflated beta mixed effects regression model, with experiment type (control or VIP ablation) as fixed effect, mouse with nested imaging field of view as random effect.

