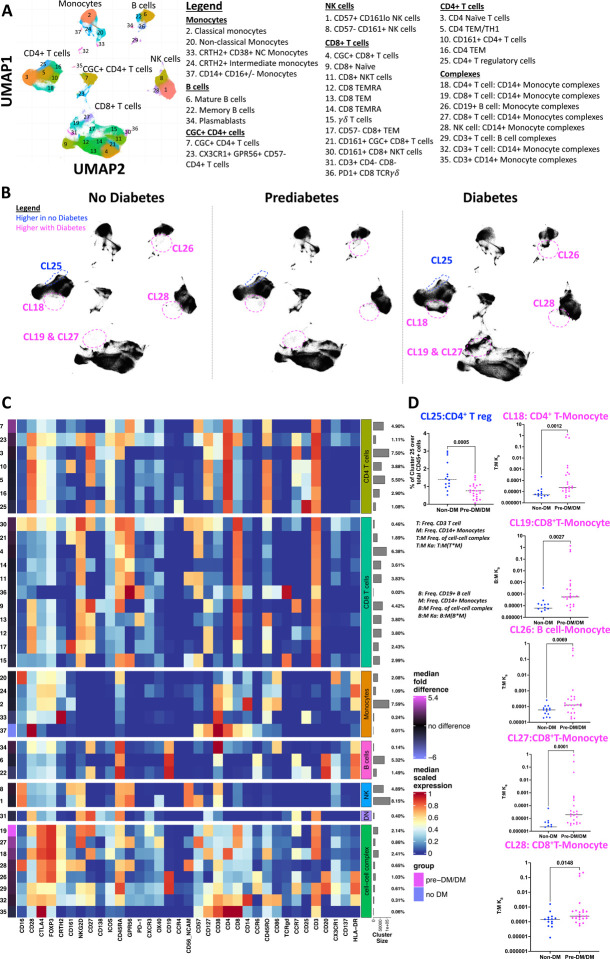
Figure 1. Phenotypic characterization of PBMCs in non-diabetic, prediabetic, and diabetic PLWH highlights differences by metabolic disease category.
(A) UMAP of 1.5 million CD45+ cells from the PBMCs of 38 participants with controlled HIV depicting clusters of monocytes, CD4+ T cells, CD8+ T cells, B cells, and NK cells.
(B) UMAPs stratified by metabolic disease (no diabetes, prediabetes, and diabetes). For each UMAP, we downsampled to 40000 events per sample from all 38 participants. Clusters 18, 19, 26, 27, and 28 have cell-cell complexes and are significantly higher with prediabetes/diabetes compared to no diabetes. Other clusters that differ by diabetes are included in Table S2.
(C) Heat map shows all markers used to define clusters in the UMAPs. The median fold difference legend bar (purple clusters are significantly higher in prediabetics/diabetics and blue are higher in non-diabetic PLWH). Clusters in the heat map are grouped according to the bigger clusters (labels on the right). The percentages indicate the number of cells in that cluster proportional to the total number of cells analyzed.
(D) Dot plots show the % CD4+ T regulatory cell cluster over total live CD45+ and the constant of association between T/B cells and monocytes in the complex clusters 18, 19, 26, 27, and 28 by diabetes status.
Statistical analysis by Mann-Whitney test (D).

