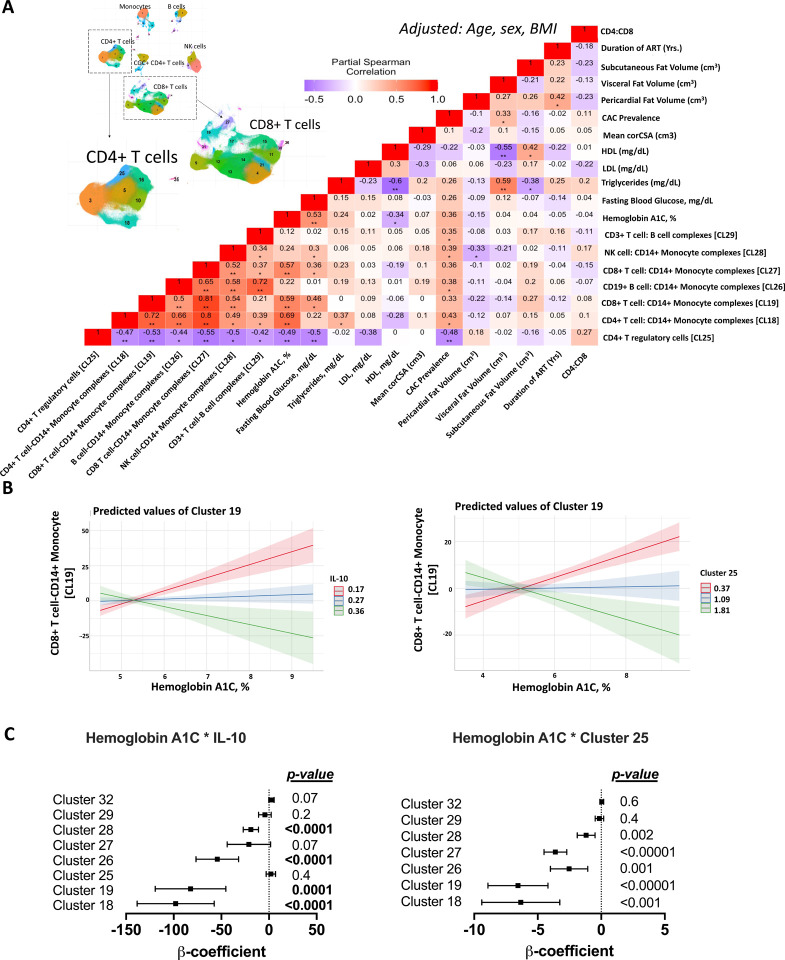
Figure 3. T cell-monocyte complexes are positively associated with blood glucose and negatively with IL-10 and CD4+ T regulatory cells in PLWH.
(A) Heatmap shows partial Spearman correlation between cell-cell complex clusters, CD4+ T regulatory cells from 38 participants as defined by mass cytometry, and hemoglobin A1c, fasting blood glucose adjusted for age, sex, and BMI (* p< 0.05, ** p<0.01). UMAP with clusters from Figure1 is included for reference.
(B) Linear regression analysis with cell-cell complexes as the dependent variable and hemoglobin A1C*IL-10 or hemoglobin A1C*Cluster 25 as the independent variables. The line plots depict the relationship between CD8+ T cell – CD14+ monocyte complexes and hemoglobin A1C, with IL-10 as the interaction term (left) and CD4 T regulatory cells as the interaction term (right).
(C) A similar analysis was performed for all cell-cell complex clusters, showing the β coefficients, the 95% confidence intervals, and p-values.
See Figure S3.

