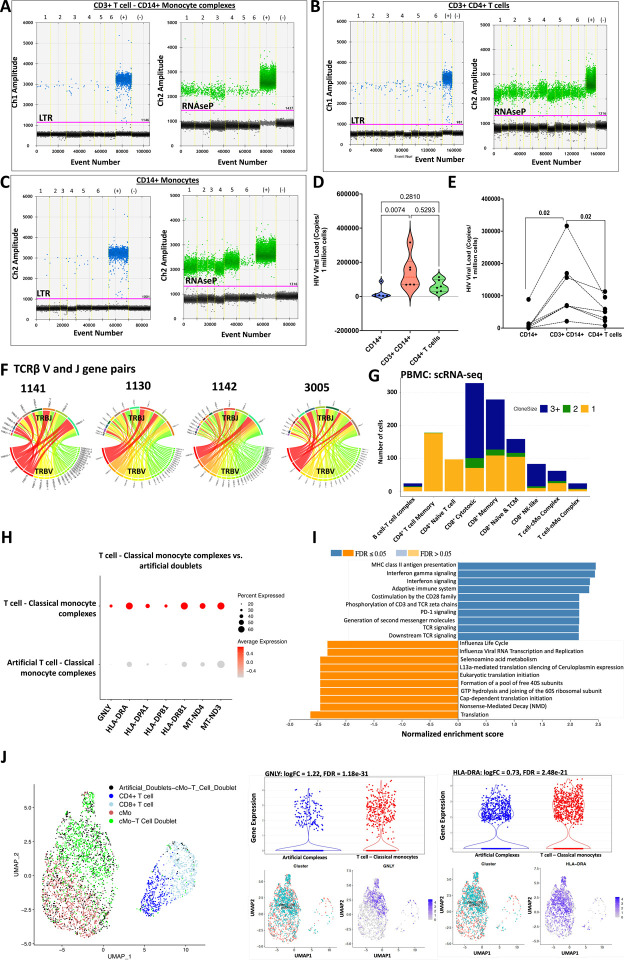
Figure 6. CD3+ T cell-CD14+ monocyte complexes from PLWH have more copies of HIV compared to singlet CD4+ T cells and CD14+ monocytes.
(A) Representative ddPCR plot showing HIV-LTR (blue droplets) and RNase P (green droplets) copies in sorted CD3+ T cell-CD14+ monocyte complexes, (B) CD3+ CD4+ T cells and (C) CD14+ monocytes from PLWH.
(D) Violin plot shows ddPCR results for HIV quantification from 6 PLWH.
(E) The line plot shows HIV viral copies in paired samples.
(F) Single CD3+ T cell: CD14+ monocyte complexes were index-sorted from PBMCs followed by TCR sequencing. The Circos plot shows TCRβ V-J gene pairs of T cells complexed with monocytes from four PLWH (1130, 1141, 1142, and 3005).
(G) TCR sequences were obtained from CITE-seq analysis of PBMCs from one individual with many CD3+ T cells-CD14+ monocyte complexes. The stacked bar chart shows the total number of cells with TCRs and is color-coded based on the clonality of the cells (shared complementarity-determining region 3 (CDR3) sequences with ≥ 2 were considered clonal).
(H) Dot plot shows genes that are differentially expressed in T cell-classical monocyte complexes compared to artificial T cell-monocyte complexes from the same scRNA-seq data set.
(I) GSEA analysis shows the Reactome pathways enriched by differentially expressed genes that are higher in the T cell-classical monocyte complexes (blue bars) when compared to the artificial complexes (orange bars).
(J) UMAP shows artificial complexes and CD3+ T cell-CD14+ classical monocyte complexes among other T cells (left panel). Violin plots and UMAPs show differential gene expression of GNLY (middle panel) and HLA-DRA (right panel).
Statistical analysis using Kruskal Wallis (D), Wilcoxon test (E).
See Tables S7e

