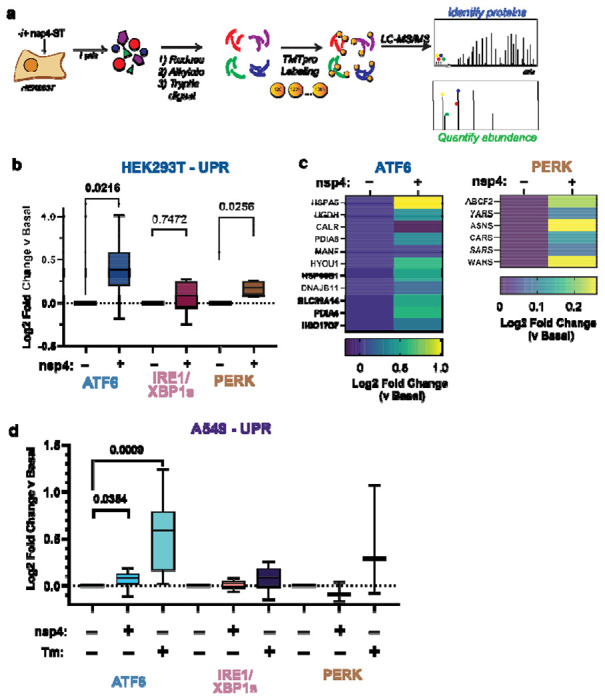
Figure 2. SARS-CoV-2 nsp4 upregulates the ATF6 and PERK pathways as measured by quantitative proteomics.

a) Experimental schematic to measure UPR induction by SARS-CoV-2 nsp4-ST expression in HEK293T cells using tandem mass spectrometry (LC/MS-MS) and TMTpro-based quantification.
b) Log2 fold change of UPR branch protein markers in the absence (GFP) or presence of SARS-CoV-2 nsp4-ST, as outlined in (a) assessed by TMT reporter ion intensities. Values represent individual protein markers previously defined by RNA-seq analysis to be transcriptionally upregulated upon stress-independent activation of respective UPR branches 6,24,30. Box-and-whisker plot shows median, 25th and 75th quartiles, and minimum and maximum values. n = 3 biological replicates, 1 MS run, one-way ANOVA with Geisser–Greenhouse correction and post-hoc Tukey’s multiple comparison test was used to test significance, p<0.05 considered significant. See Supplemental Tables S2, S3 for mass spectrometry data set.
c) Heatmap of individual log2 fold change for ATF6 and PERK protein markers in the absence or presence of SARS-CoV-2 nsp4-ST.
d) Log2 fold change of UPR branch protein markers in A549 lung epithelial cells the presence of SARS-CoV-2 nsp4-FT or Tunicamycin (1 μg/mL, 16 h) compared to basal control (GFP). UPR branch protein markers were defined as in (b). Box-and-whisker plot shows median, 25th and 75th quartiles, and minimum and maximum values. n = 4 biological replicates, 1 MS run, one-way ANOVA with Geisser–Greenhouse correction and post-hoc Tukey’s multiple comparison test was used to test significance, p<0.05 considered significant. See Supplemental Tables S4, S5 for mass spectrometry data set.
