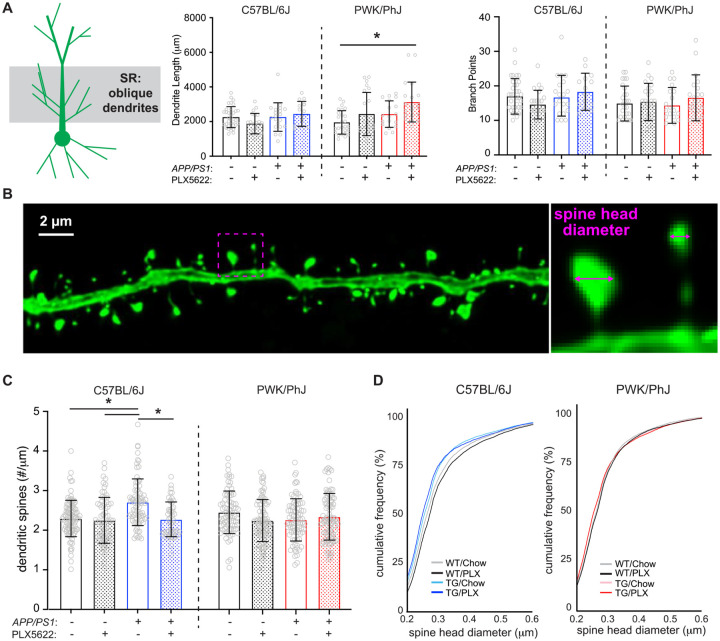
Figure 2: Amyloid- and microglia-dependent spine plasticity in oblique branches from B6 but not PWK mice.
(A) Oblique dendritic lengths (left) and branch points (right). Individual data points represent each reconstructed neuron (n=3–5/mouse); error bars are ± SD; asterisks denote post-hoc (p<0.05) after two-way ANOVA and corrections for multiple comparisons.
(B) Example deconvolved confocal image of an EGFP+ oblique branch. Spine density was acquired across dendrites (left) and individual spines measured for maximum head diameter (right).
(C) Oblique branch spine densities across genotype/treatment groups. Data points represent individual branches (n=10–15/mouse); error bars are ± SD; asterisks denote comparisons (p<0.05) identified between control and PLX5622 groups after two-way ANOVA and corrections for multiple comparisons.
(D) Spine head diameter cumulative distributions from B6 (left) and PWK (right). Kolmogorov-Smirnov (K-S) tests were used to evaluate statistical significance (see Table S3).
Statistical analyses performed on B6 and PWK separately. For (A) and (C) *adjusted p<0.05 Bonferroni post-hoc tests (Table S3).

