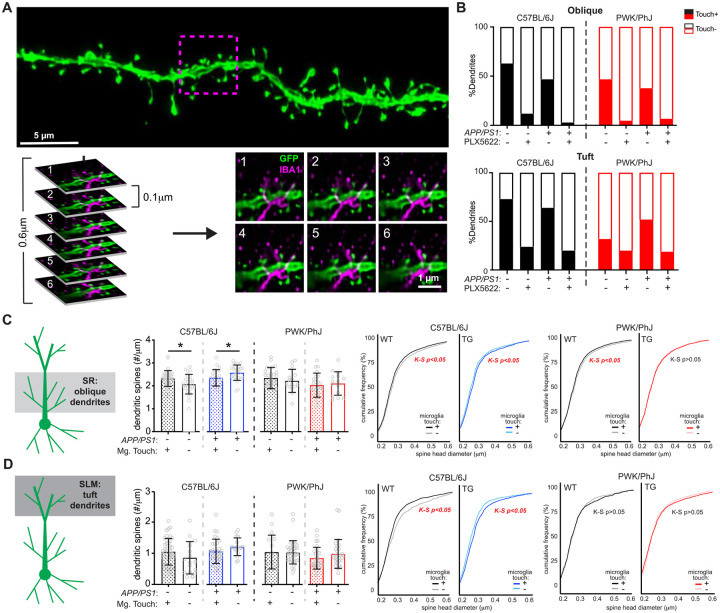
Figure 4: Microglia-dendrite interactions shape spine density and morphology.
(A) Deconvolved confocal image of dendritic branch (green) with the region of microglia-dendrite interaction marked by a magenta box (top). Individual z-slices from the stack (0.1μm steps) with the IBA1+ microglia (in magenta) interacting with the EGFP+ dendrite (green) (bottom). Numbers in upper left hand denote z-steps.
(B) Dendrite proportions that were classified as Touch+ or Touch− across oblique (top) and tuft (bottom) dendrites.
(C) Spine densities (left) and cumulative distributions for spine head diameters (right) from oblique Touch+ and Touch− dendrites. Datapoints represent individual branches (n=5–10/mouse) and analyzed with unpaired t-tests between Touch+ and Touch− branches from B6 (middle) and PWK (right). K-S tests were used to evaluate statistical differences (see Table S6)
(D) Identical analyses to (C) for tuft dendrites. See Table S7 for statistics.
For (C) and (D) *p<0.05, unpaired t-test.

