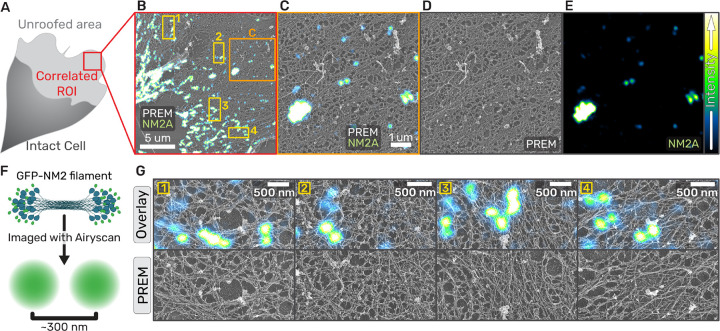
Fig. 3. NM2 filaments assemble in wide array of actin architectures.
(a) Cartoon of migrating fibroblast with unroofed lamella used for CLEM. (b) Overlay of correlated platinum replica electron micrograph and super-resolution fluorescent micrograph of EGFP-NM2A in an unroofed lamella. Orange box indicates the zoom inset in (c-e) and yellow numbered boxes indicate examples used in (g). (c) Separate images of the zoom inset of the example correlation (left panel) with fluorescent EGFP-2A (right panel) and platinum replica depicting ventral actin network (center panel). Scale bars = 1 um. Intensity LUTs are indicated to the right. (f) Cartoon depicting EGFP-NM2A in filamentous form and the fluorescent signal that is detected from this structure. (g) Examples of EGFP-NM2A clusters in the top ‘overlay’ panel coupled with the underlying actin ultrastructure displayed in the PREM-alone frames in the bottom ‘PREM’ panel. Scale bars = 500 nm.

