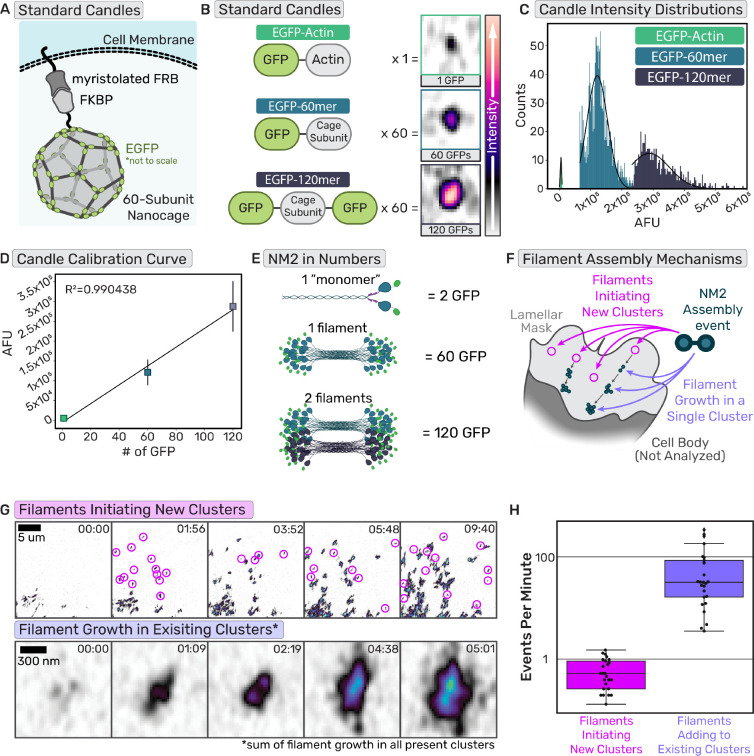
Fig. 6. Established NM2 filaments are sites of enhanced filament assembly.
(a) Cartoon of protein nanocage used as a known standard for the calibration curve. (b) Cartoons of the domains of the standard proteins used with the number of subunits per polymer and representative images of the standard in cells. Intensity scale bar on the right. (c) Intensity histograms of the known standards (d) Calibration curve generated from the intensity distributions of the standards and the number of subunits. n= 15 cells each candle, each experimental day. (e) Example cartoon of NM2 monomer, filament, and filaments tagged with EGFP with the number of EGFPs in those structures. (f) Cartoon delineating two different NM2 filament assembly mechanisms, initiation of new clusters or adding to existing clusters. (g)Example frames of cluster appearance tracking and NM2 filament growth tracking. Scale bar = 5 um; 300nm. (h) Quantification of cluster appearance rates compared to NM2 filament growth rates. n= 26 cells over 3 experiments

