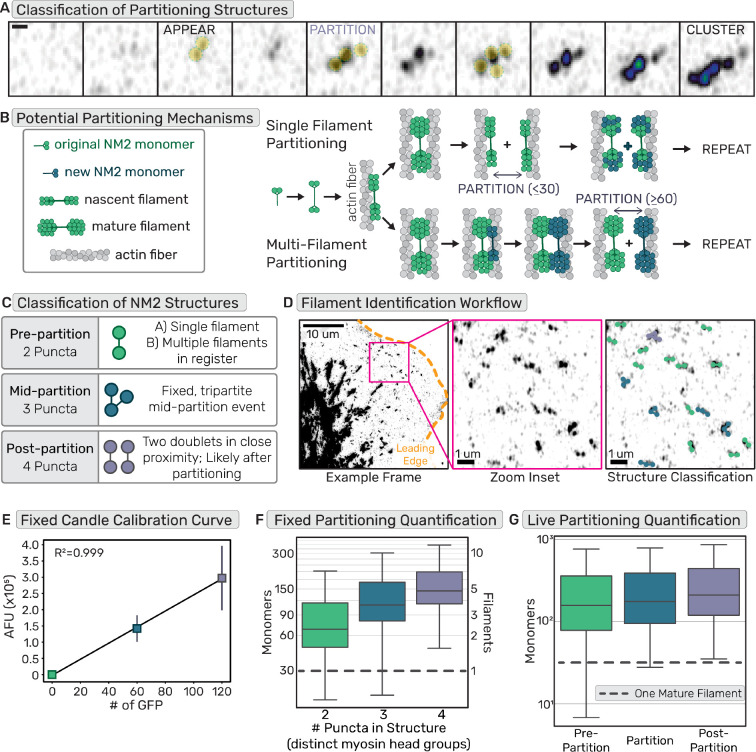
Fig. 7. NM2 structures amplify to sub-resolution stacks before partitioning.
(a) Example frames of EGFP-NM2A filament appearance, partitioning, and cluster growth. Scale bar = 300nm. (b) Cartoon depicting two non-exclusive mechanisms of NM2 partitioning, containing either single or multiple filaments. (c) Classification of single time-point or fixed frames of NM2 fluorescent structures grouping structures based on number of peaks/puncta and assigning them to stages of partitioning. (d) EGFP-NM2A sum projection example frame (left) with leading edge outlined in orange and zoom inset in magenta. Scale bar = 10um. Zoom inset (middle). Scale bar = 1um. Zoom inset overlay (right) displays detected NM2 filaments color coded into classes based on number of detected puncta in the fluorescent structures. Scale bar = 1um. (e) Example calibration curve for a fixed molecular counting data set. n= 15 cells each candle, each experimental day. (f) Fixed NM2 partitioning results with a grey dotted line to indicate a single mature NM2 filament. n= 45 cells over 3 experiments (g) Live NM2 partitioning results with a grey dotted line to indicate a single mature NM2 filament. n= 26 cells over 3 experiments

