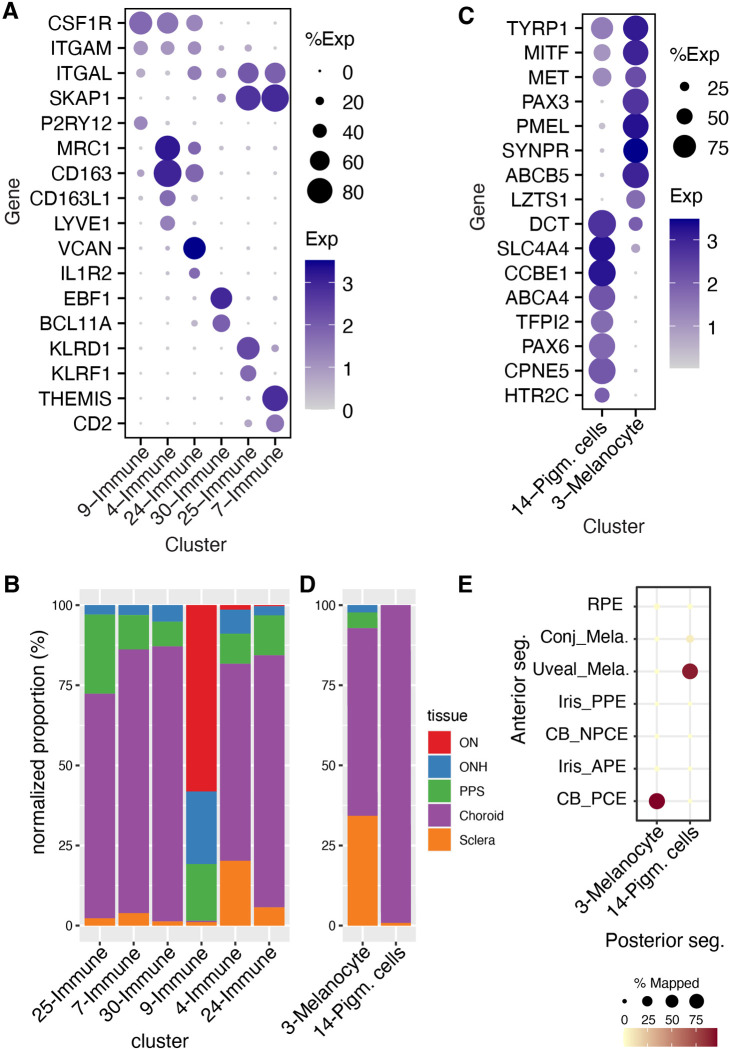
Fig. 6.
Immune and pigmented cells. (A) Dot plot showing genes selectively expressed by each of the immune-related cell types. (B) Histogram showing the relative abundance of each immune-related cluster in each tissue. (C) Dot plot showing genes selectively expressed by each type of melanocytes. (D) Histogram showing the abundance of the pigmented cell clusters C3 and C14 in each tissue. (E) Confusion matrix showing transcriptional correspondence of C3 and C14 in the current dataset to those in the anterior segment described in van Zyl et al., (9) and to RPE.

