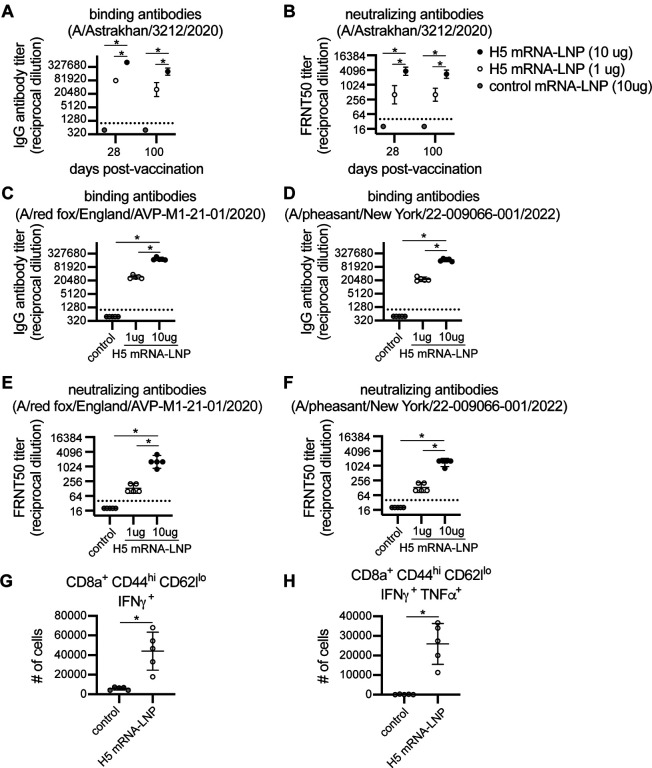
Figure 1. Clade 2.3.4.4b H5 HA mRNA-LNP vaccine induces humoral and cellular immune response in mice.
(A-F) Five mice were included per experimental group. Mice were vaccinated i.m. with 1 or 10 μg A/Astrakhan/3212/2020 HA mRNA-LNP or 10 μg Ovalbumin mRNA-LNP (control mRNA-LNP). (A-B) Serum samples were collected from mice at 28 and 100 days after vaccination. (A) Serum IgG titers reactive to A/Astrakhan/3212/2020 recombinant HA protein were quantified by ELISA. (B) A/Astrakhan/3212/2020 neutralizing antibodies were quantified; reciprocal dilutions of serum required to inhibit 50% virus infection are shown. (C-D) Serum samples collected 28 days after vaccination were tested by ELISA to quantify IgG reactive to A/red fox/England/AVP-M1–21-01/2020 or A/pheasant/New York/22–009066-001/2022 recombinant HA proteins. (E-F) A/red fox/England/AVPM1–21-01/2020 and A/pheasant/New York/22–009066-001/2022 neutralizing antibodies were quantified in serum samples collected 28 days after vaccination; reciprocal dilution of serum amounts required to inhibit 50% virus infection are shown. (G-H) Five mice per group were vaccinated i.m. with 1 μg A/Astrakhan/3212/2020 HA mRNA-LNP or 1 μg Ovalbumin mRNA-LNP (control mRNA-LNP). Spleens were harvested at 10 days after vaccination and splenocytes were incubated with H5 HA overlapping peptide pools before completing intracellular cytokine staining and flow cytometric analysis of CD8 T cells. Number of IFN-γ producing CD8+ T cells and IFN-γ and TFN-α producing CD8+ cells were quantified. All data are shown as geometric means ± 95% confidence intervals. Data in (A-F) were compared using one-way ANOVA with Tukey’s post hoc test. Values were log-transformed prior to statistical analysis. Data in (G-H) were compared using an unpaired two-tailed t test. Data are representative of 2 independent experiments. *P < 0.05

