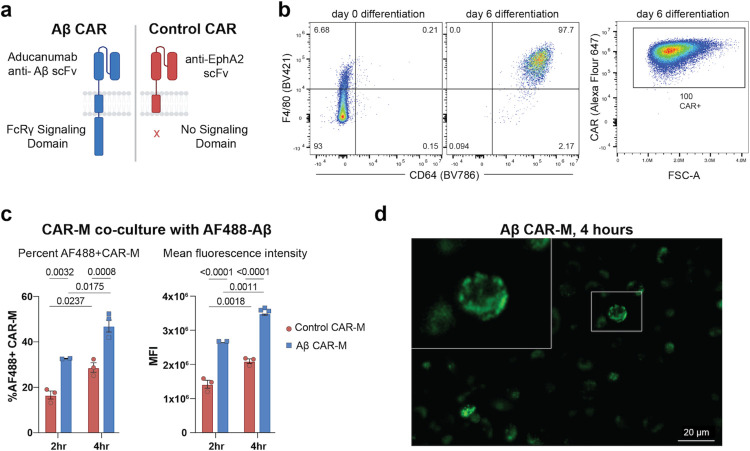
Figure 1: Generation of an aducanumab-based Aβ CAR-M and validation of CARmediated uptake of soluble Aβ.
a) Schematic diagram of Aβ CAR and Control CAR constructs. b) Representative FACS plots of (left) F4/80 and CD64 surface expression on HoxB8 cells at day 0 and day 6 of differentiation with M-CSF; (right) surface CAR expression on cells at day 6 of differentiation. FSC-A, forward scatter area. c) In vitro phagocytosis of AlexaFlour488 fluorescent tagged Aβ(1–42) by Aβ CAR Ms or control CAR-Ms after 2 or 4 hours of co-incubation, depicted as % uptake (left) or mean fluorescence intensity (MFI, right). Data is represented as mean ± s.e.m. from n=2–3 independent experiments with 2–3 technical replicates for each condition. Statistical significance was calculated with 2-way ANOVA with Šidàk’s multiple comparisons test d) Representative image of Aβ CAR Ms co-cultured with AF488 tagged Aβ(1–42) for 4 hours.

