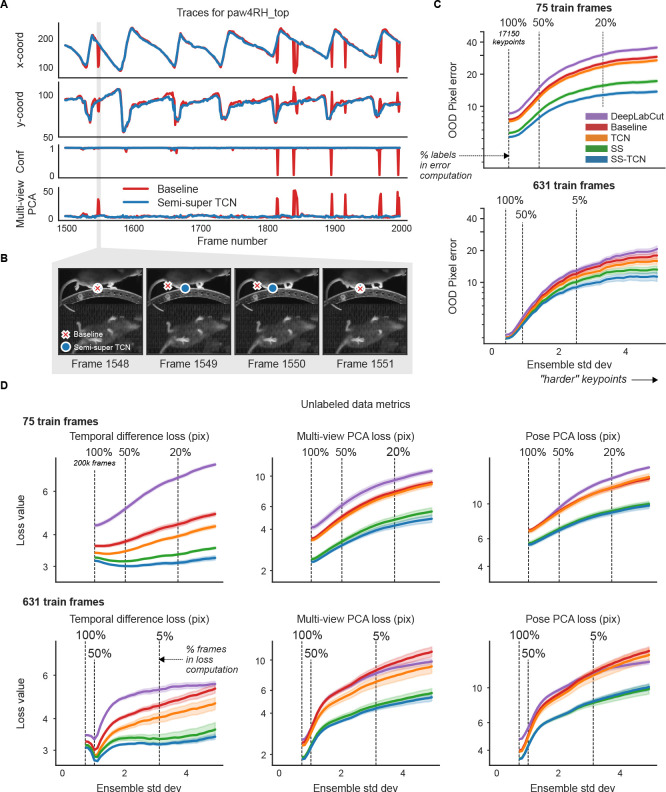
Figure 4: Unlabeled frames improve pose estimation (raw network predictions).
A. Example traces from the baseline model and the semi-supervised TCN model (trained with 75 labeled frames) for a single keypoint (right hind paw; top view) on a held-out video (Supplementary Video 5). The semi-supervised TCN model is able to resolve the visible glitches in the trace, only some of which are flagged by the baseline model’s low confidence. One erroneous paw switch missed by confidence – but captured by multi-view PCA loss – is shaded in gray. B. A sequence of frames (1548–1551) corresponding to the gray shaded region in panel A in which a paw switch occurs. The estimates from both models are initially correct, then at Frame 1549 the baseline model prediction jumps to the incorrect paw, and stays there until it jumps back at Frame 1551. C. We compute the standard deviation of each keypoint prediction in each frame in the OOD labeled data across all model types and seeds (five random shuffles of training data). We then take the mean pixel error over all keypoints with a standard deviation larger than a threshold value, for each model type. Smaller standard deviation thresholds include more of the data (n=17150 keypoints total, indicated by the “100%” vertical line; (253 frames) × (5 seeds) × (14 keypoints) - missing labels), while larger standard deviation thresholds highlight more “difficult” keypoints. Error bands represent standard error of the mean over all included keypoints and frames for a given standard deviation threshold. D. Individual unsupervised loss terms are plotted as a function of ensemble standard deviation for the scarce (top) and abundant (bottom) label regimes. Error bands as in panel C, except we first compute the average loss over all keypoints in the frame (200k frames total; (40k frames) × (5 seeds)).

