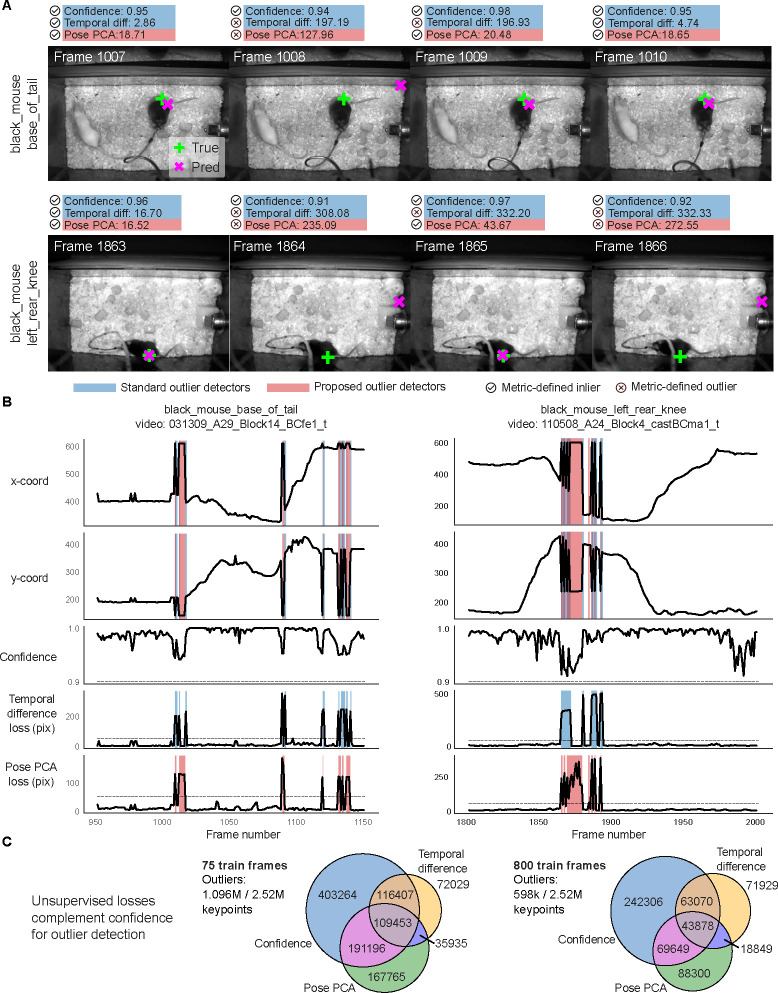
Extended Data Figure 2: Unsupervised losses complement model confidence for outlier detection on CRIM13 dataset.
Example traces, unsupervised metrics, and predictions from a DeepLabCut model (trained on 800 frames) on held-out videos. Conventions for panels A-C as in Fig. 3. A: Example frame sequence. In the first row, note that the second prediction jumps to the cage wall with high confidence, but is flagged as problematic by the Pose PCA loss. In the second row, the prediction again jumps back and forth between the mouse and the cage wall, and only the Pose PCA metric properly captures which predictions are outliers across all frames. B: Example traces from the same video. Because the size of CRIM13 frames are larger than those of the mirror-mouse and mirror-fish datasets, we use a threshold of 50 pixels instead of 20 to define outliers through the unsupervised losses. C: Total number of keypoints flagged as outliers by each metric, and their overlap. Outliers are collected from predictions across frames from 18 test videos and across predictions from five different networks trained on random subsets of labeled data.

