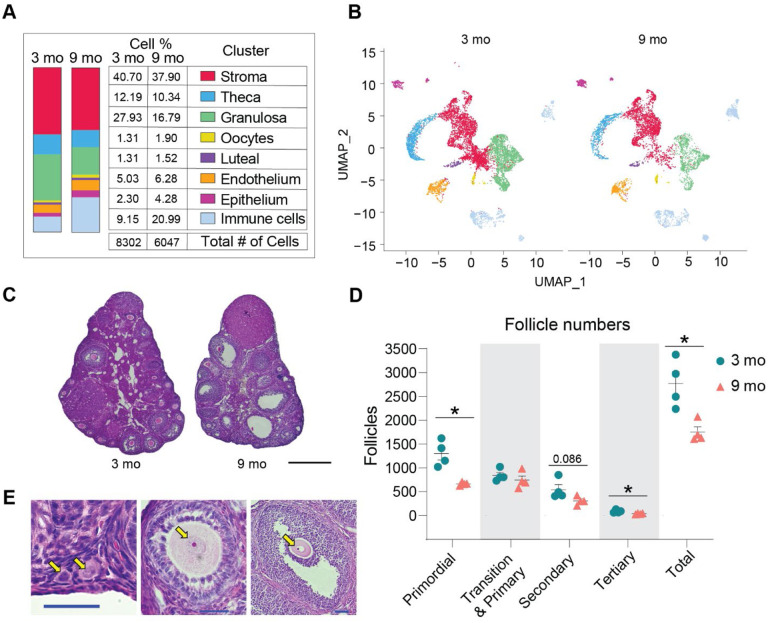
Fig. 2. Age-related changes in ovarian cell populations.
(A) The number and percentage of cells in broad categories of cell type identity by age. (B) UMAP plot of ovarian cells split by age. (C) Representative images of H&E stained ovaries. (D) Estimated number of ovarian follicles in 3- and 9-month-old ovaries. (E) Representative images of follicles stained by H&E. Arrows are pointing to a primordial, primary, secondary and tertiary follicles (from left to right). Data are presented as mean ± SEM. *, **, *** represent statistical difference (FDR<0.05, 0.01 and 0.005, respectively) by multiple two-tailed t-test with Benjamini, Krieger, and Yekutieli correction for multiple comparisons. Black scale bars represent 500μm and blue scale bars represent 50μm. scRNA-seq was performed in n=4 ovaries/age.

