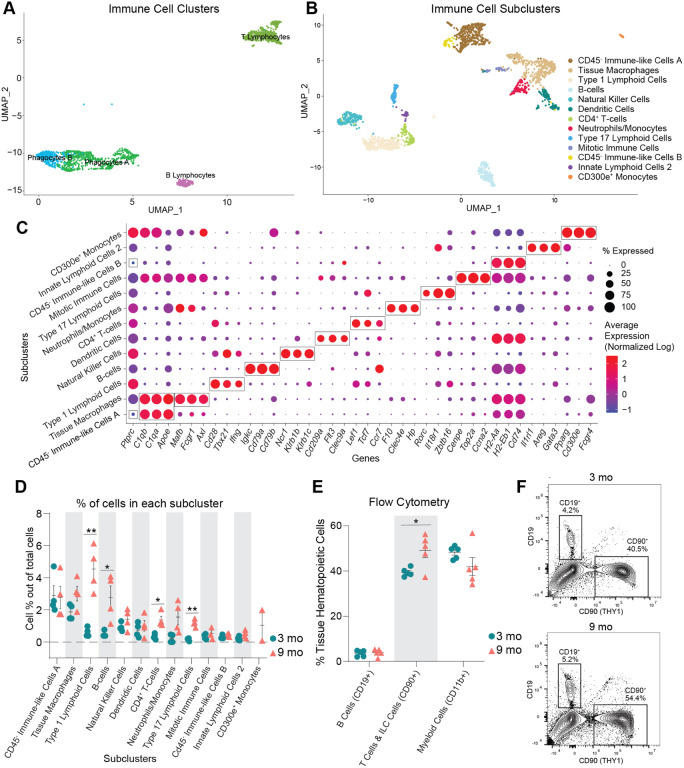
Fig. 3. Immune cells accumulate in the ovaries with age.
(A) UMAP of immune CLUs selected for sub-clustering analyses. (B) UMAP of immune SCL. (C) Dot plot of markers used for SCL cell-type identification. (D) Percentage of cells in each immune SCL out of total cells. (E) Percentages of immune cells out of tissue hematopoietic cells (after gating out intravascular hematopoietic cells) by flow cytometry. (F) Representative images of flow cytometry gating for CD19+ and CD90+ cells out of tissue hematopoietic cells (i.v. CD45−; CD45+) in young and aged ovaries (see Suppl. Fig 4A for the complete gating strategy). For flow cytometry, 6 ovaries from mice in the same phase of estrous cycle were pooled together to comprise each sample (n=5/age). scRNA-seq was performed in n=4 ovaries/age. Data are presented as mean ± SEM. *, **, *** represent statistical difference (FDR<0.05, 0.01 and 0.005, respectively) by multiple two-tailed t-test with Benjamini, Krieger, and Yekutieli correction for multiple comparisons.

