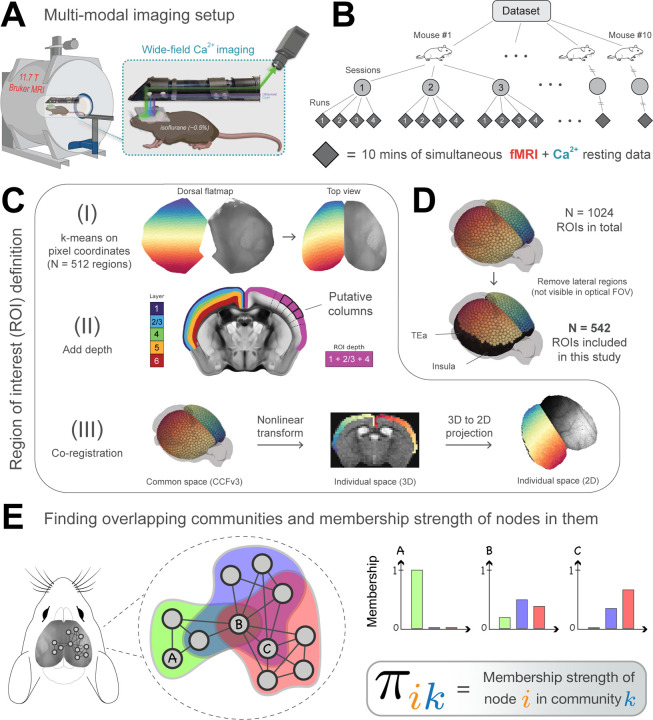
Figure 1:
Experimental setup and overlapping community analysis. (A) Simultaneous fMRI-BOLD and wide-field Ca2+ imaging [1]. Ca2+ data are background-corrected (illustrated by three colored wavelengths; Methods) (B) Hierarchical data structure. N = 10 mice, scanned across 3 longitudinal sessions, with 4 runs per session, each lasting 10 minutes. (C) Definition of ROIs within the Allen Mouse Brain Common Coordinate Framework (CCFv3) [35]. (I) Division of the mouse dorsal flatmap into N = 1024 spatially homogeneous ROIs. (II) Add depth by following streamlines normal to the cortical surface. The resulting ROIs are “column-like”. (III) Transform ROIs from common space into 3D and 2D individual spaces (Methods). Dorsal flatmap, layer masks, and columnar streamlines from CCFv3. (D) Analyses were restricted to ROIs that appeared in the Ca2+ imaging FOV after multimodal co-registration (Methods). Lateral areas including the insula and temporal association areas were excluded. (E) We applied a mixed-membership stochastic blockmodel algorithm to estimate overlapping communities [29]. Membership strength (values between 0 and 1) quantifies the affiliation strength of a node in a network. Here, node A belongs only to the green community, node B belongs to all three communities with varying strengths, and node C belongs to the blue and red communities with varying strengths.

