
Figure 3:
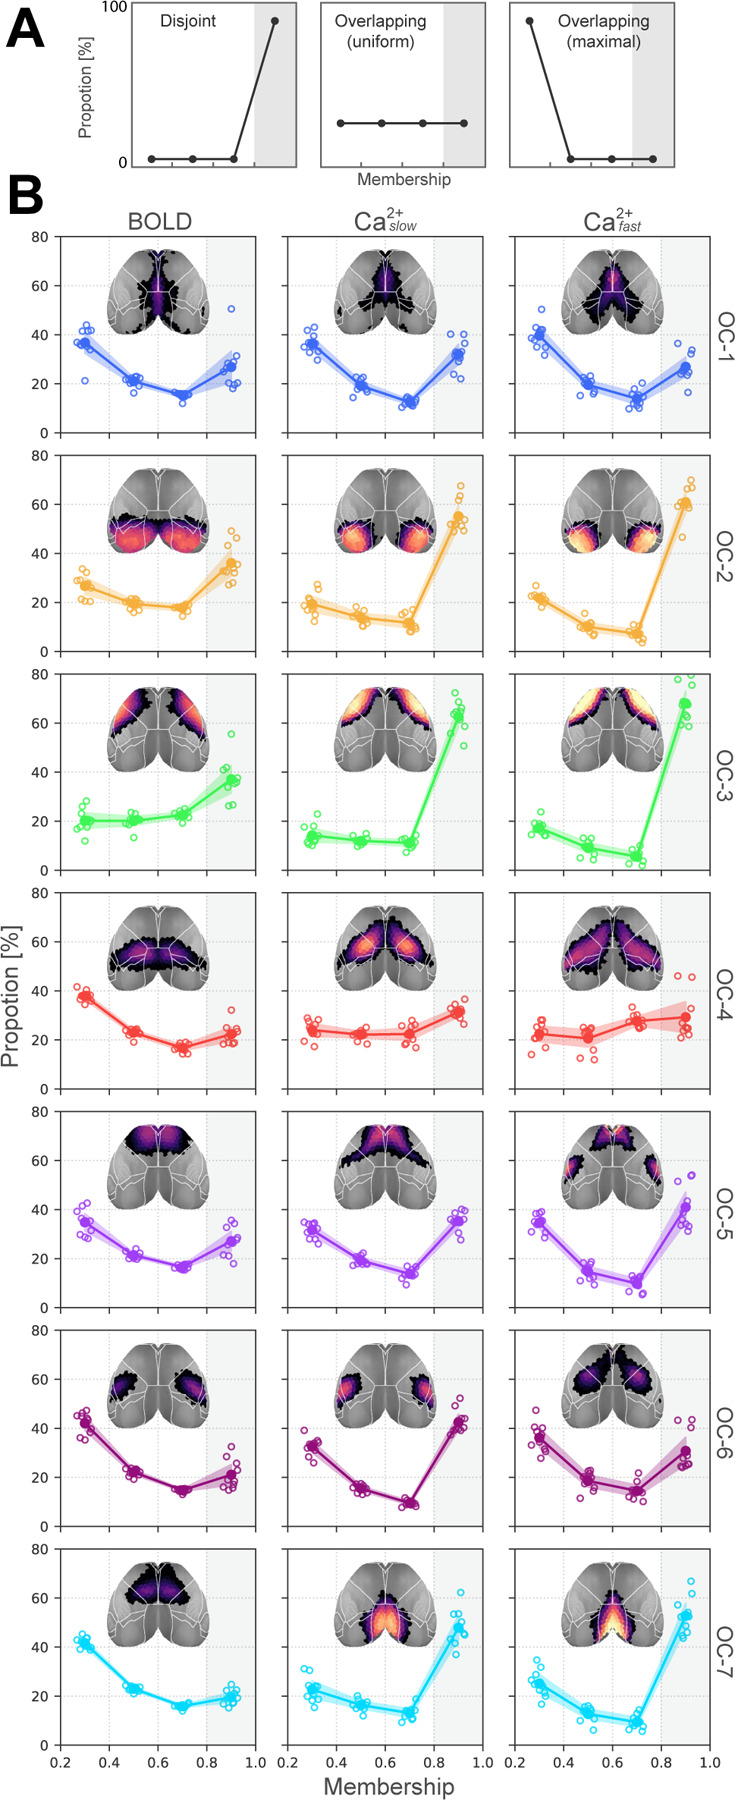
Distribution of membership values. (A) Three illustrative distributions. Left, disjoint organization; Middle, overlapping with uniform membership values; Right, completely overlapping with no mid-range or strong memberships. (B) Membership distributions computed from multimodal data indicate substantial overlapping organization. Note that the y-axis is capped at 80%, indicating that none of the networks are truly disjoint. Empty circles correspond to individual animals; large solid circles are the group average. Abbreviations: OC, overlapping community. Compare with Figure S5 for membership distributions obtained from synthetic graphs with known ground truth overlap.