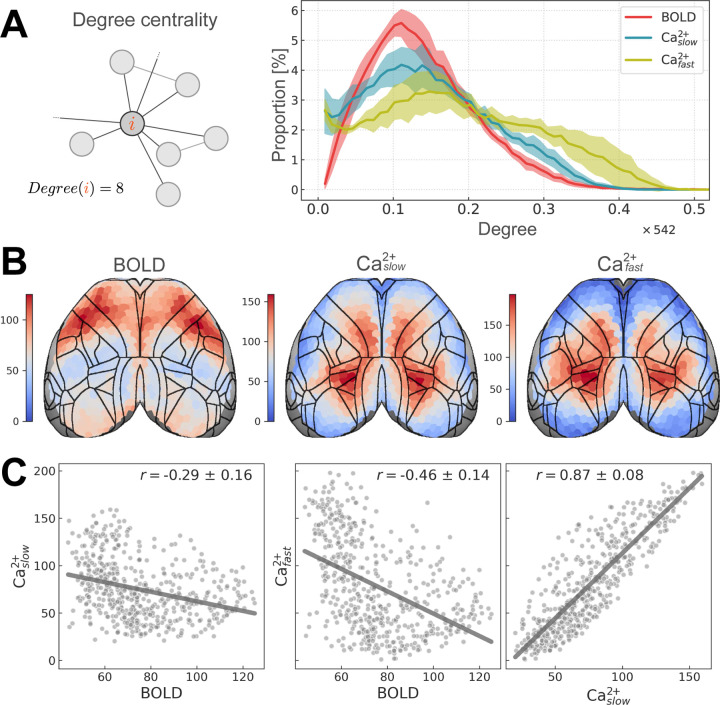
Figure 6:
Regional degree. (A) Left: schematic of regional degree. Right: distribution of regional degree normalized by number of brain regions (total of 542). (B) Regional degree visualized on the cortex. Densely connected regions have high degree (hot colors), whereas sparsely connected regions have low degree (cool colors). BOLD and Ca2+ conditions show opposing spatial patterns. (C) Similarity between conditions is quantified using (Pearson) correlation. BOLD and Ca2+ are negatively correlated whereas Ca2+ conditions are highly positively correlated (variability obtained based on hierarchical bootstrapping; Methods).

